| Computer Modeling in Engineering & Sciences |
DOI: 10.32604/cmes.2021.014693
ARTICLE
Mesoscopic-Scale Numerical Investigation Including the Influence of Process Parameters on LPBF Multi-Layer Multi-Path Formation
Institute for Systems Rheology, School of Mechanical and Electrical Engineering, Guangzhou University, Guangzhou Higher Education Mega Center, Guangzhou, 510006, China
*Corresponding Author: Liu Cao. Email: caoliu@gzhu.edu.cn
Received: 20 October 2020; Accepted: 19 November 2020
Abstract: As a typical laser additive manufacturing technology, laser powder bed fusion (LPBF) has achieved demonstration applications in aerospace, biomedical and other fields. However, how to select process parameters quickly and reasonably is still the main concern of LPBF production. In order to quantitatively analyze the influence of different process parameters (laser power, scanning speed, hatch space and layer thickness) on the LPBF process, the multi-layer and multi-path forming process of LPBF was predicted based on the open-source discrete element method framework Yade and the open-source finite volume method framework OpenFOAM. Based on the design of experiments method, a four-factor three-level orthogonal test scheme was designed, and the porosity and surface roughness data of each calculation scheme were extracted. By analyzing the orthogonal test data, it was found that as the laser power increased, the porosity decreased, and as the scanning speed, hatch space, and layer thickness increased, the porosity increased. In addition, the influence of laser power and scanning speed on surface roughness showed a trend of decreasing first and then increasing, while the influence of scanning distance and layer thickness on surface roughness showed a monotonous increasing trend. The order of the influence of each process parameter on porosity was: scanning speed > laying thickness>laser power > hatch space, and the order of the influence of each process parameter on surface roughness was: hatch space > layer thickness > laser power > scanning speed. So the porosity of the part is most sensitive to scanning speed, and the surface roughness is the most sensitive to hatch space. The above conclusions are expected to provide process control basis for actual LPBF production of the 316L stainless steel alloy.
Keywords: Laser powder bed fusion; process parameter; porosity; surface roughness; orthogonal test method; numerical simulation
As a typical laser additive manufacturing technology, laser powder bed fusion (LPBF) has gradually been used for direct forming of complex metal parts, and has achieved exemplary applications in aerospace, biomedical and other fields [1,2]. However, the current LPBF production still faces many limitations, for example, the focus of LPBF engineers is still how to quickly and reasonably select process parameters so that the porosity [3] and surface roughness [4] are at a low level. Therefore, in-depth study of the influence of process parameters on the LPBF process plays an important role in accelerating the industrial application of LPBF technology.
Regarding the influence of process parameters on the LPBF process, scholars have carried out a large number of experimental studies. Among them, the process parameters mainly include laser power [5,6], exposure time [7], scanning speed [8,9], hatch space [10,11] and layer thickness [12], and the quality indicators mainly include porosity [13], surface roughness [14], residual stress [15], deformation [16,17], microstructure [18] and mechanical properties (yield strength [19], tensile strength [20], elongation [21] and microhardness [22]). Jiang et al. [23] used the normalization method to comprehensively analyze the influence of multiple process parameters on the LPBF process, and evaluated the influence of laser power, scanning speed, hatch space and their combination on density, surface roughness and microhardness through analysis of variance, and found that laser power had the greatest influence on the forming quality. The obtained experimental research results [5–23] are of great value to deeply understand the influence mechanism of process parameters on the LPBF process.
The core of the LPBF process is that the metal particles gradually melt after being heated by the laser, and then solidify to form a solidified track. This process is a typical high temperature and high transient physical process, where the highest temperature can reach 4000 C [24], and the characteristic time of molten pool flow is on the order of microseconds [25]. Although the current experimental methods such as X-ray in-situ imaging technology and high-speed cameras can observe the LPBF process in real time [26], the experimental methods are difficult to accurately obtain the three-dimensional information of the LPBF process, such as the evolution of the three-dimensional shape of the molten pool. As a typical quantitative research method, numerical simulation has become a powerful auxiliary method for analyzing LPBF process [27–29]. At present, the simulation research for the LPBF process is mainly based on the following three scales: (a) macroscopic-scale, that is, by establishing a simplified model, the transition between the three phases “powder bed-metal liquid-phase-metal solid-phase” is equivalently handled to obtain the temperature field and stress field distribution [30–35]; (b) Mesoscopic-scale, that is, the heating effect of the laser on the metal particles is directly calculated to describe the dynamic behavior of the mesoscopic molten pool [36–41]; (c) Microscopic-scale, that is, based on the thermal field information of the LPBF process, the growth behavior of dendrites is described [42,43]. Yuan et al. [44] predicted the LPBF process at different scanning speeds based on the mesoscopic scale, and identified three mesoscopic molten pool states (unstable state, transition state, and steady state), and found that a stable molten pool with a small recessed area was beneficial to obtain a higher density part. The obtained simulation research results [27–44] provide a way to predict the temperature, molten pool flow, stress and other information of the LPBF process, but the current simulation research lacks a comprehensive analysis of the influence of process parameters on the LPBF multi-layer and multi-path process based on the mesoscopic scale, which is also the focus of this paper.
This paper was based on the open-source discrete element method (DEM) framework Yade and the open-source finite volume method (FVM) framework OpenFOAM to predict the multi-layer multi-path process of LPBF. In order to quantitatively analyze the effects of different process parameters (laser power, scanning speed, hatch space and layer thickness) on the porosity and surface roughness, based on the design of experiments (DOE) method, a four-factor three-level orthogonal test scheme was designed, and the calculated results were compared with the experimental results. This paper is expected to provide a basis for process control in actual LPBF production.
(1) Modeling the spreading powder process
The premise of describing the LPBF process based on the mesoscopic scale is to obtain the particle distribution of the powder bed. As a numerical calculation method for solving and analyzing the motion law and mechanical characteristics of complex discrete systems, DEM can be used to characterize collision and friction behaviors in particle systems [45]. The LPBF spreading powder process was predicted here based on DEM [39], and the calculation process was divided into the following four steps: (a) The metal particles were regarded as elastic spheres with contact friction effect, and the particle size distribution curve of the powder was obtained by means of experimental methods or literature data; (b) A particle cluster was generated in a certain space above the substrate and spread loosely on the substrate under the action of gravity; (c) The roller was moved to spread the powder, during which the contact friction between the roller and the particles and between the particles were considered; (d) After spreading powder, the sphere center coordinates and radius of the powder bed particles were derived.
(2) Laser heat source model
The way the laser energy is applied is very important to describe the LPBF process based on the mesoscopic scale. In order to ensure the reasonable application of laser energy and high calculation efficiency, the multi-reflection absorption effect was ignored and the “metal phase-gas phase” interface was traced firstly in real time, then the elements directly acted by the laser were determined according to the laser spot center and radius. Using the elements directly acted by the laser as the starting points, the elements within a certain distance along the direction of gravity were found and marked as the elements indirectly acted by the laser, and finally the laser energy was applied in the form of a body heat source. Eqs. (1)–(5) is the laser heat source model established herein, in which,  represents the proportion of laser energy in the horizontal local area of a certain element acted by the laser, and Eqs. (4) and (5) is the volume of fluid (VOF) model [46]. It should be noted that Eqs. (1)–(3) are original.


where,  is the laser body energy density, W/m3;
  is the laser energy distribution coefficient;
  is the laser surface energy density, W/m2;
  is the equivalent size of the element, such as the side length of a cube, m;
  is the laser absorption rate of the metal;
  is the laser power, W; R is the spot radius, m;
  are the horizontal coordinates of the element’s center, m;
  are the horizontal coordinates of the spot’s center, m;
  is the scanning rate, m/s; t is the time, s;
  is the metal-phase volume of the element, m3; Vsum is the sum of the metal-phase volumes of the elements acted by the laser under the same local horizontal area, m3;
  are the volume fractions of the metal-phase and gas-phase of the element, respectively;
  is the velocity, m/s.
(3) Mesoscopic molten pool dynamics model
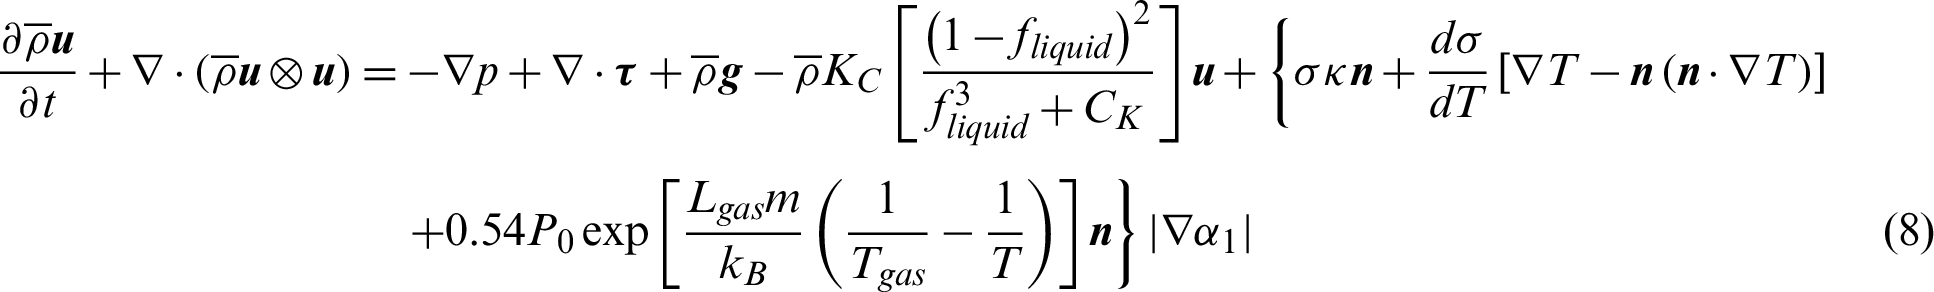
Eqs. (6)–(12) is the LPBF mesoscopic molten pool dynamics model established herein, in which Eqs. (6) and (7) is the energy conservation equation, Eqs. (8)–(11) is the momentum conservation equation, and Eq. (12) is the mass conservation equation. In order to ensure the efficiency of numerical solution, two assumptions were made: the flow of liquid metal and gas were regarded as laminar flow of incompressible Newtonian fluid, and the mass loss caused by metal gasification was not considered.
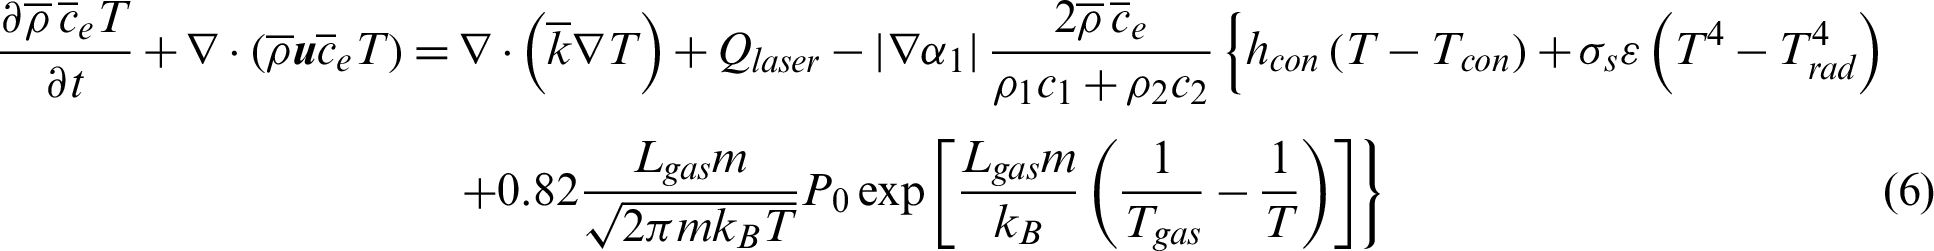


where,  are the mixed, metal and gas densities, respectively, kg/m3; T is the temperature, K;
  are the equivalent [41], metal and gas specific heat capacities, respectively, J/(
 );
);  is the mixed thermal conductivity, W/(
 ); hcon is the interface convection heat transfer coefficient, W/(m
 ); Tcon is the external convection temperature, K;
  is the Stefan–Boltzmann constant, W/(m
 );
);  is the emissivity; Trad is the outside radiation temperature, K; Lgas is the metal vaporization latent heat, J/kg; m is the metal molecular mass, kg; kB is the Boltzmann constant, J/K; P0 is the standard atmospheric pressure, Pa; Tgas is the metal vaporization temperature, K; p is the pressure, Pa;
  is the stress tensor;
  is the hybrid viscosity, Pa
 s;
s;  is the acceleration of gravity, m/s2; KC is the drag coefficient of the mushy zone [47], 1/s;
  is the liquid-phase ratio; CK is a self-defined smaller value, such as 10−6;
  is the surface tension coefficient, N/m;
  is the coefficient of surface tension change with temperature, N/(m
 K);
K);  is the interface curvature, 1/m;
  is the normal vector of the interface.
The open-source DEM framework Yade was used to calculate the spreading powder process, and the open-source FVM framework OpenFOAM was used to predict the LPBF multi-layer multi-path process. Fig. 1 shows the calculation flow of LPBF multi-layer multi-path process, which mainly includes the following steps: (a) Import the particle size distribution data into Yade, generate a particle cluster on the substrate, then move the roller to complete the spreading powder work of the first layer, and export the particles’ center coordinates and radius data of the first layer of powder bed; (b) Import the particle information of the first layer of powder bed into the 3D modeling software to obtain the geometric model, develop the LPBF process solver based on OpenFOAM, predict the forming process of the first layer of powder bed, and derive the STL model of the first formed layer; (c) Import the STL model obtained in step (b) into Yade, calculate the spreading powder process for the second layer, and derive the particles’ center coordinates and radius data of the second layer of powder bed; (d) Import the particle information of the second layer of powder bed into the 3D modeling software to obtain the geometric model, predict the forming process of the second layer based on OpenFOAM, and derive the STL model of the second formed layer; (e) Repeat steps (c, d) to predict the forming process of the subsequent layer. It should be noted that the molten pool had been cooled down to the room temperature when anther spreading powder process started.

Figure 1: Calculation flow of LPBF multi-layer multi-path process: (a1–a3) spreading the first layer of powder bed ( ); (b1–b3) forming the first layer of powder bed (
 of the first formed layer); (c1–c3) spreading the second layer of powder bed (
 ); (d1–d3) forming the second layer of powder bed (
 )
)
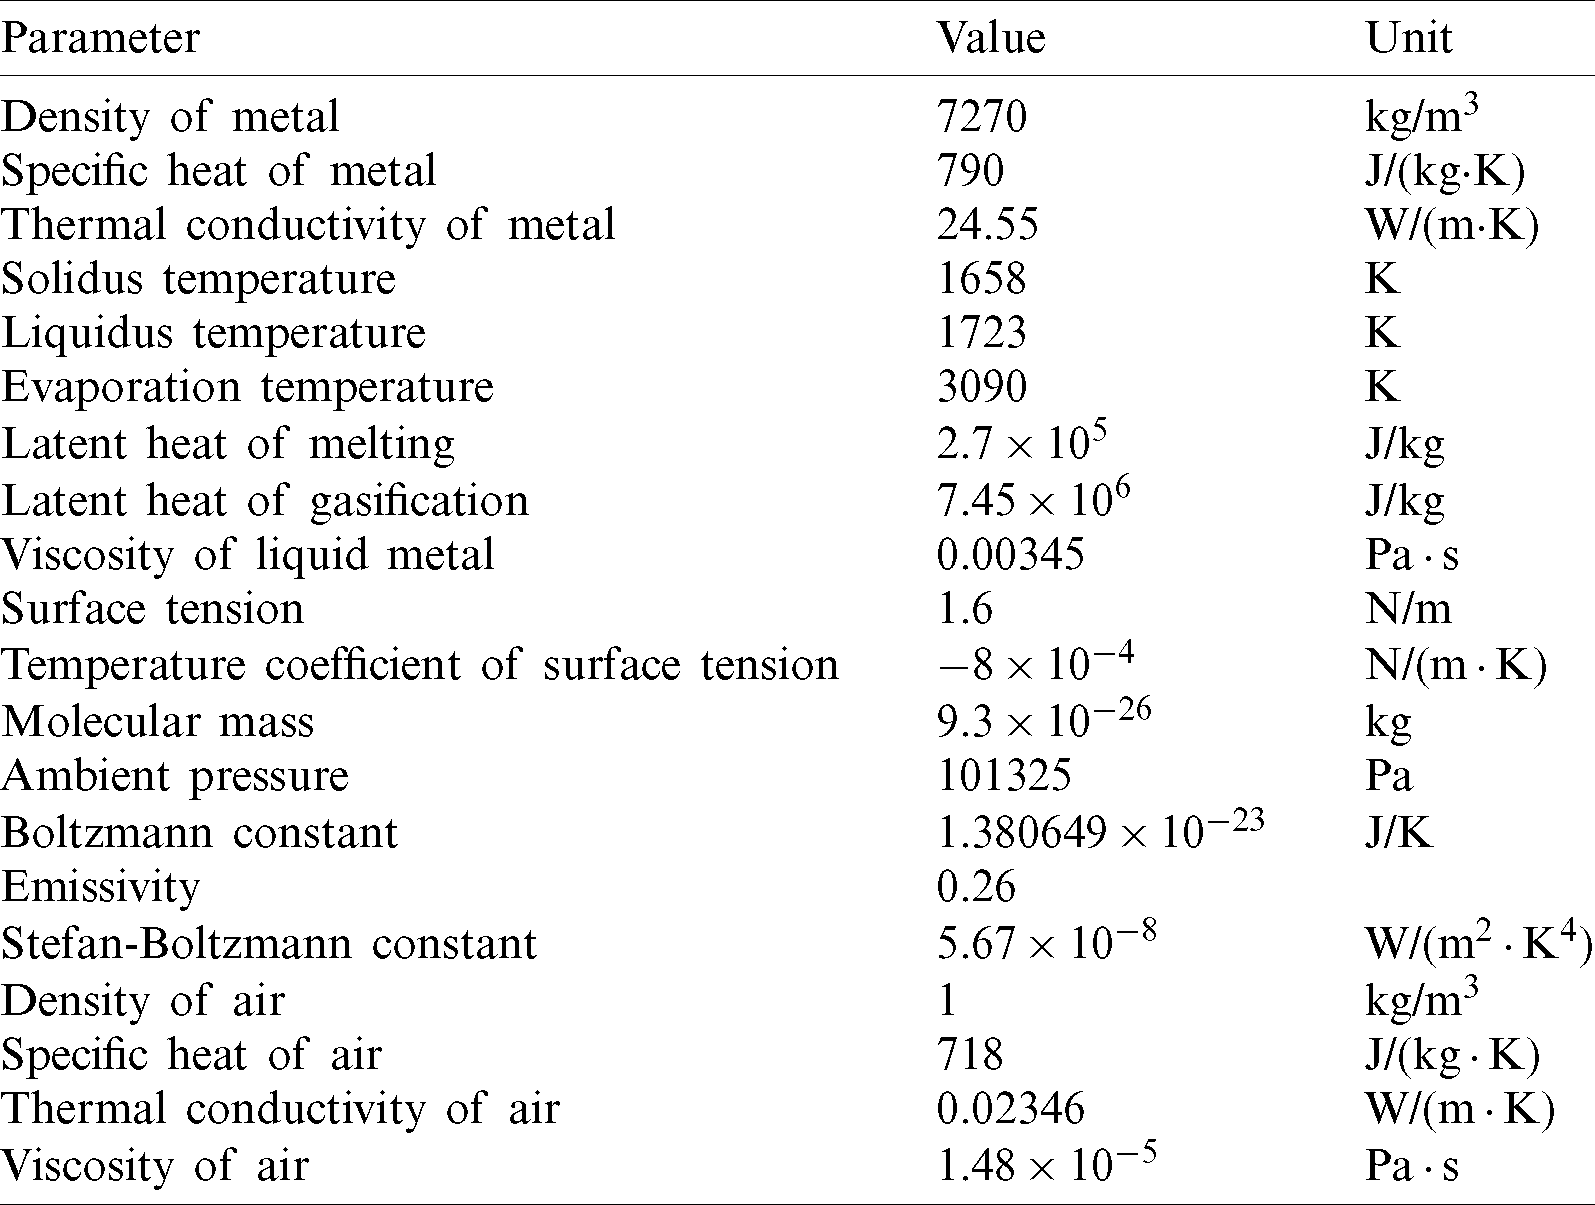
The metal powder used here was 316L stainless steel, and its alloy composition (mass percentage) is: Fe 65.395%–Cr 17.0%–Ni 12.0%-Mo 2.5%–Mn 2.0%–Si 1.0%–P 0.045%–C 0.03%–S 0.03%. Tab. 1 shows the physical properties of 316L stainless steel and air obtained with the software JMatPro v7.0. The particle size distribution of the stainless steel powder satisfied a Gaussian distribution (the central value is 25  m, and the variance is 5
  m), and the particle size was artificially limited between 15
  m and 35
  m. When simulating the spreading powder process based on Yade, the set material parameters included density (7270 kg/m3), contact friction angle (0.1), Young’s modulus (195 GPa) and Poisson’s ratio (0.3).
Table 1: Physical properties of 316L stainless steel and air
The focus of this paper is to analyze the influence of process parameters on the LPBF multi-layer multi-path process based on the mesoscopic scale, and the considered process parameters include laser power, scanning speed, hatch space and layer thickness. In order to analyze the sensitivity of each process parameter, the orthogonal experiment method for the design of experiments was adopted, and Tab. 2 is the four-factor and three-level parameter table of process parameters, and Tab. 3 is the corresponding orthogonal test schemes. The reason for choosing the parameter values in Tab. 2 is that these parameter values are commonly used in actual LPBF schemes. Fig. 2 is a schematic diagram of the multi-layer multi-path forming process of each calculation scheme. Three layers of powder bed were formed together, and the laser scanned three paths for each layer of the powder bed. In order to control the size of the calculation domain as much as possible, the geometric dimensions of the calculation domain of each calculation scheme were X-direction (650  m), Y-direction (
 ) and Z-direction (
 m). In addition, the laser spot diameter was 70
  m, the mesh size was 2.5
  m, the calculation time step was
  s, the laser absorption rate was 0.35, the ambient temperature was 300 K, and the computing resource used was configured as Intel Xeon Gold 5120 CPU (dual CPU, 56 threads, 96 GB memory).
Table 2: Four-factor and three-level parameter table
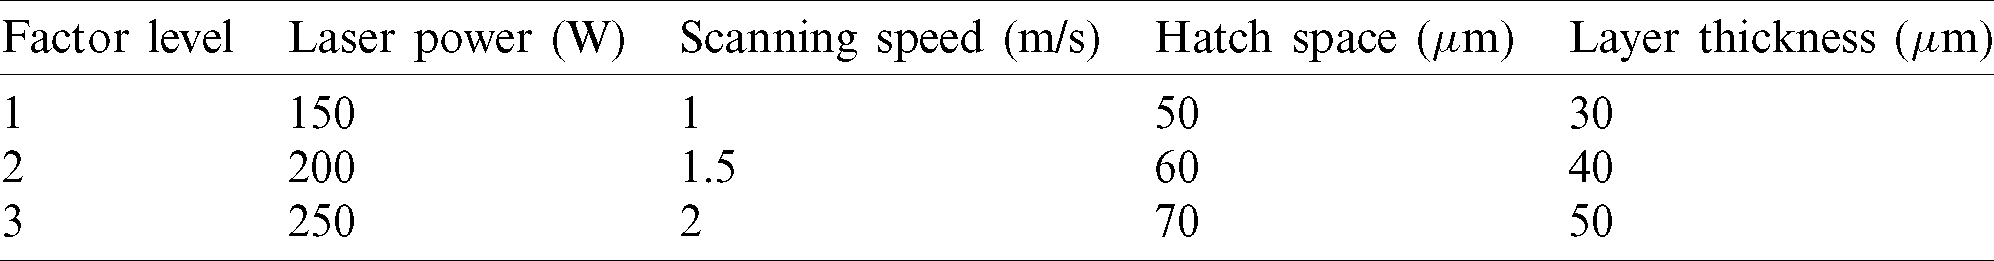
Table 3: Orthogonal test schemes
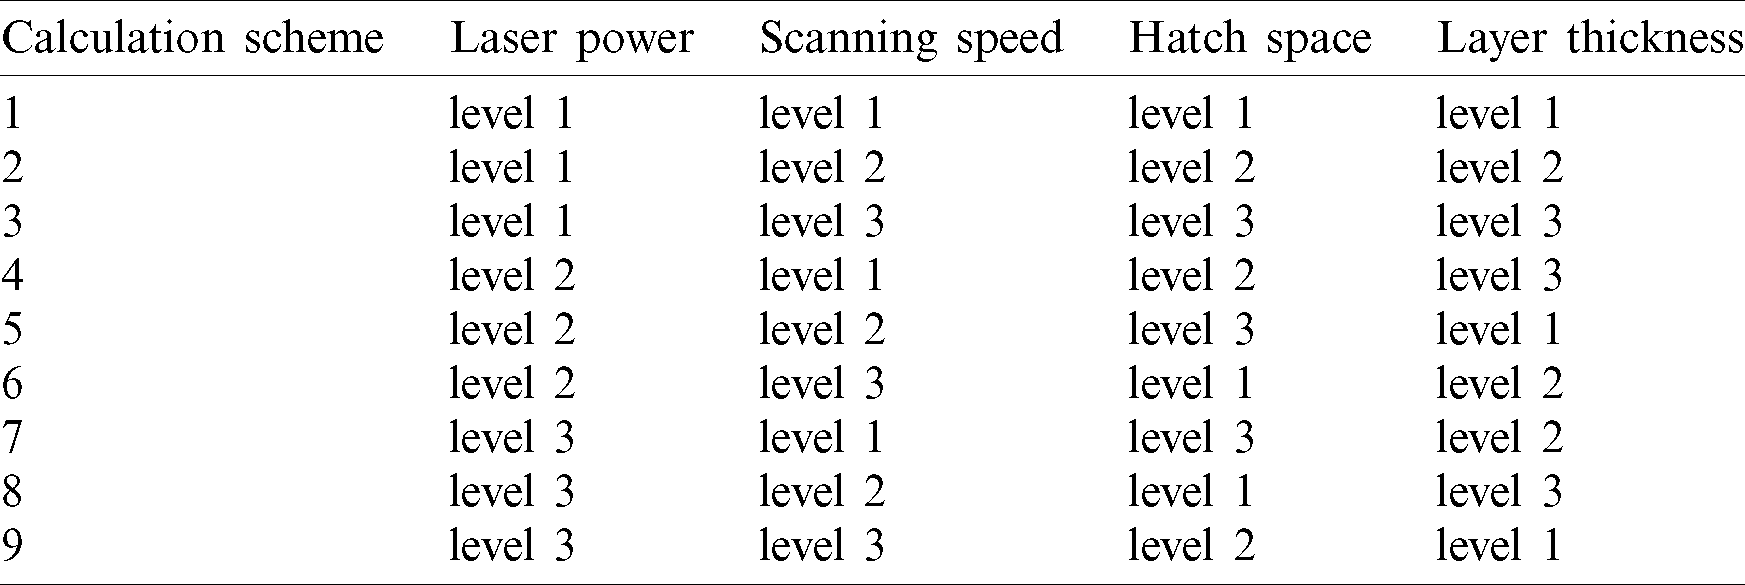

Figure 2: Schematic diagram of the multi-layer multi-path forming process
3.2 Extraction of Porosity and Surface Roughness Data
Firstly, the simulation results were illustrated. Here, calculation Scheme 1 was taken as an example. Fig. 3 shows the temperature and molten pool distributions when forming each layer and each path. From the calculation results, it could be seen that, on one hand, the metal particles were rapidly melted by the laser heating, forming a molten pool, and even gasification; on the other hand, as the laser beam was in motion, the overheated molten pool continuously conducted heat to the surrounding metal and radiated heat to the external environment, making the molten pool in a quasi-steady state during the forming process. So it could be considered basically that the shape of the molten pool had always maintained a “droplet” shape. Fig. 4 shows the surface morphology of each formed layer. It could be clearly seen that there were bumps between adjacent solidified tracks. The reason for the bumps is that, on one hand, the surface of the molten pool formed a depression under the action of the gasification recoil, the so-called pinhole effect, so that the liquid metal in the molten pool was squeezed from the center of the laser spot to the surroundings; on the other hand, because the temperature of the molten pool surface presented an obvious distribution of “high spot center-lower surroundings,” the liquid metal near the molten pool surface tended to flow from the spot center to the surroundings under the Marangoni effect. Under the combined action of the above two reasons, the height of the side of the molten pool was higher than that of the adjacent solidified track, and the side was too late to recover during the subsequent cooling and solidification process, and a bump was formed. It should be noted that in the actual LPBF process, spatter and powder bed erosion also have an important influence on the forming process [48,49]. In summary, the simulation results showed that the LPBF multi-layer multi-path process were very complicated. In order to realize the sensitivity analysis of the process parameters, it is necessary to extract the key information from the simulation results to achieve the purpose of quantitative analysis.

Figure 3: Simulation results of temperature field under calculation Scheme 1 (the yellow curve represents the boundary of the molten pool; parts  represent different scanning paths): (a) Forming the first layer of powder bed; (b) Forming the second layer of powder bed; (c) Forming the third layer of powder bed
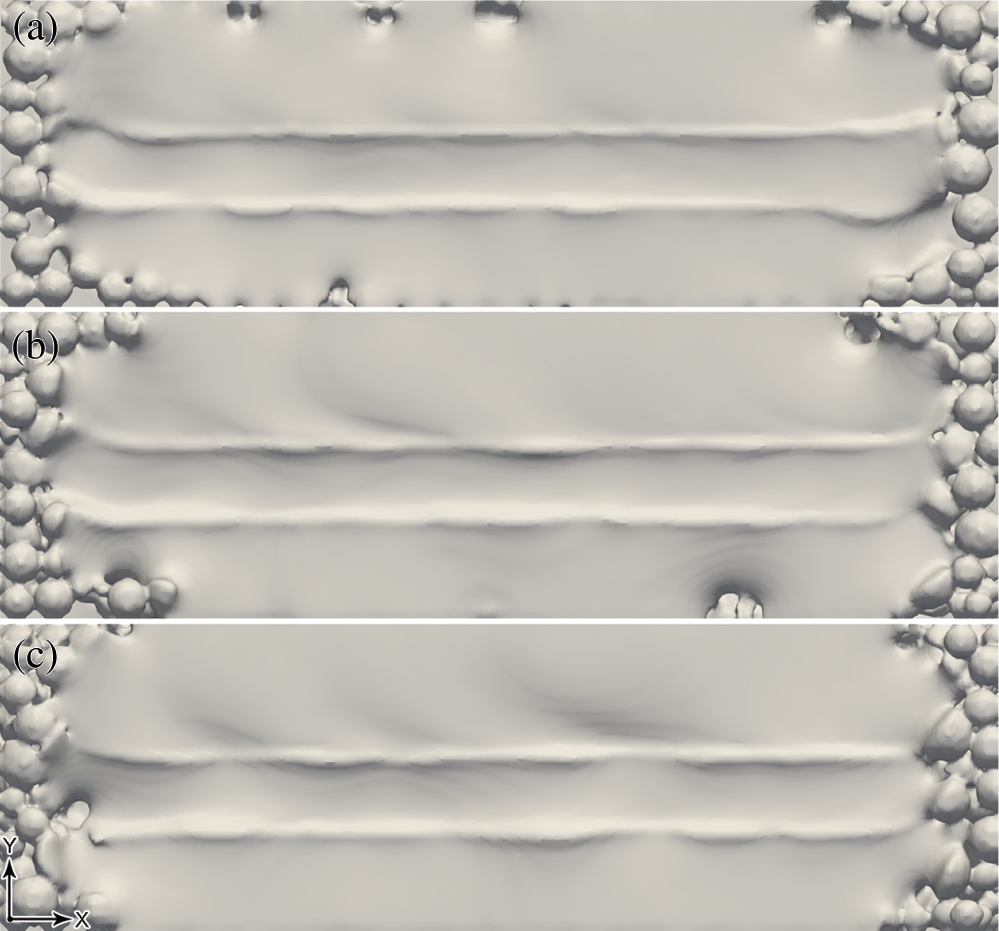
Figure 4: Surface morphology of each formed layer under calculation Scheme 1: (a) The first formed layer; (b) The second formed layer; (c) The third formed layer
The porosity and surface roughness of the parts are the main quality indicators of concern in actual production, so the porosity and surface roughness were token here as the extraction information of the simulation results. Taking calculation Scheme 1 as an example, Fig. 5 shows the final gas-solid interface obtained after forming three layers and three path, and the method to obtain this interface was to extract the isosurface of 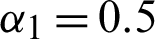 . It could be seen from Fig. 5 that since the laser did not act on the front and rear ends of the X and Y directions, a large number of gas-solid interfaces appeared in these areas, so these areas needed to be avoided when extracting information on porosity and surface roughness. Fig. 6 is a partial volume area used for calculating porosity, and the top surface of the partial volume area needed to be lower than the upper surface of the formed zone in Fig. 5. The post-processing software ParaView v5.4.0 provided the element information summing operation for the local volume area, so the calculation method of porosity is as follows:


where, Vi is the volume of the element, m3;  is the gas volume ratio of the element; N is the number of elements;
  is the total volume of the statistical area, m3; Vgas is the total volume of the gas-phase in the statistical area, m3;
  is the porosity of the statistical area.
  and Vgas could be provided by ParaView, and the extracted porosity data of each calculation scheme can be seen in Tab. 4.
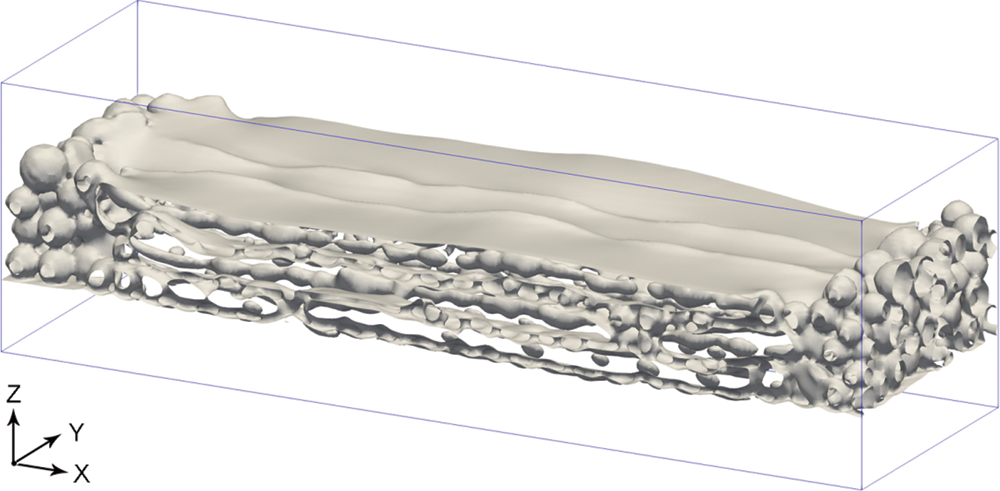
Figure 5: The final gas-solid interface under calculation Scheme 1
Figure 6: The local volume area used to calculate the porosity under calculation Scheme 1 (the blue wire frame represents the calculation domain)
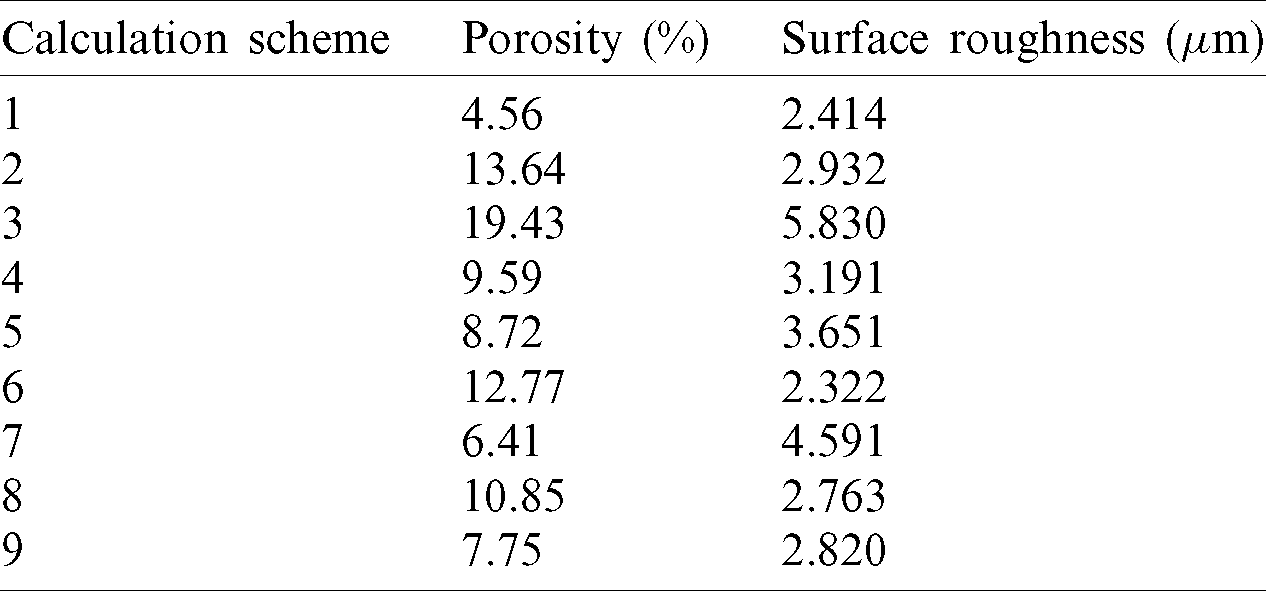
Table 4: Porosity and surface roughness data of each calculation scheme
For the extraction of surface roughness data, a partial surface area (Fig. 7) was cut out from the upper surface of the interface in Fig. 5, and it was thought that the degree of fluctuation of the partial surface area could reflect the surface roughness of the part. Fig. 8 shows the local area used to calculate the surface roughness under calculation Scheme 3. It could be clearly seen that due to the large hatch space at this time, there were metal particles that were not completely melted between the solidified tracks, and they would have a significant impact on the surface roughness, which was consistent with the actual situation. It should be noted that the size of the local area analyzed herein was limited to a few hundred microns, which is quite different from the actual surface size of the part, therefore, the so-called surface roughness data extracted here could only be regarded as a certain mapping of the actual surface roughness of the part, and the specific value could not represent the actual surface roughness. ParaView provides the operation of extracting the node information of the partial surface area, so the calculation method of surface roughness is as follows:


where, zi is the height coordinate of the node, m; m is the number of nodes;  is the average height of the nodes in the local area, m;
  is the surface roughness, m. zi could be provided by ParaView, and the extracted surface roughness data of each calculation scheme can be seen in Tab. 4.
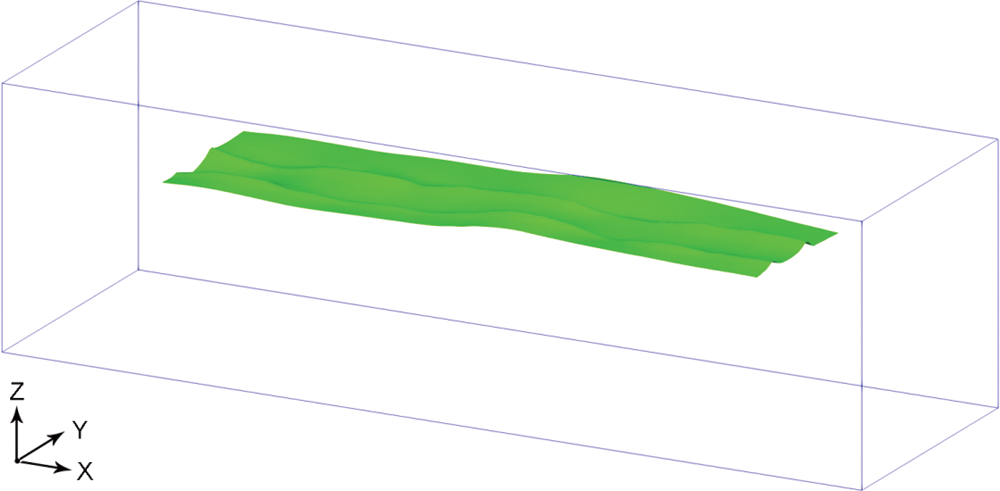
Figure 7: The local surface area used to calculate the surface roughness under calculation Scheme 1 (the blue wire frame represents the calculation domain)
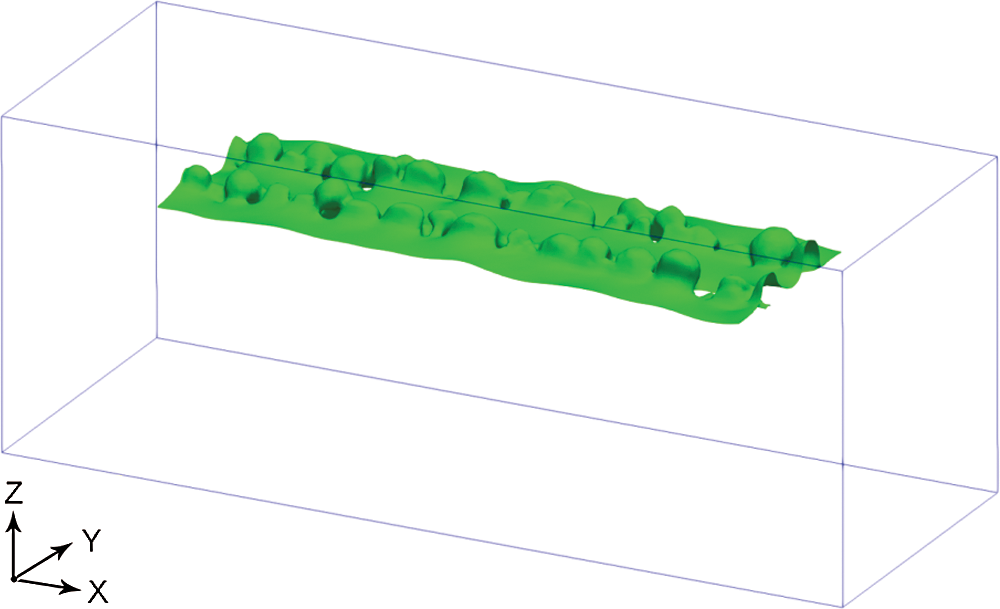
Figure 8: The local surface area used to calculate the surface roughness under calculation Scheme 3 (the blue wire frame represents the calculation domain)
3.3 Sensitivity Analysis of Process Parameters
(A) The influence of different levels of process parameter on porosity
Based on the porosity and surface roughness data of each calculation scheme in Tab. 4, the influence of process parameters on the LPBF multi-layer multi-path process could be quantitatively analyzed. For each process parameter, the influence of different level parameters on porosity was analyzed. Taking laser power as an example, according to the data analysis strategy of the orthogonal experiment method, the level 1 parameter of laser power was used in calculation Schemes 1–3, so the porosity data of calculation Schemes 1–3 should be summed and averaged, and the results reflected the influence of the level 1 parameter of laser power on porosity. Similarly, the influence of level 2 and 3 parameters of laser power on porosity could be obtained (Fig. 9a). According to this strategy, the influence of different level parameters of scanning speed (Fig. 9b), hatch space (Fig. 9c) and layer thickness (Fig. 9d) on porosity could be obtained. It can be seen from the data in Fig. 9 that the effects of laser power, scanning speed, hatch space and layer thickness on porosity all exhibited monotonicity. Among them, as the laser power increased, the porosity decreased, and as the scanning speed, hatch space and layer thickness increased, the porosity increased. Experimental research [50,51] also revealed the same law. The reason for this law is that the larger the laser power, the smaller the scanning speed, the hatch space and the layer thickness meant that the metal particles in a certain volume absorbed more laser energy, so that the metal particles could be more fully fused, and the gas in the molten pool had more sufficient escape time. It should be noted that since the highest laser power selected herein was only 250 W, the data in Fig. 9a did not reflect the entrainment phenomenon caused by the excessively high laser power, which easily causes the porosity to increase.
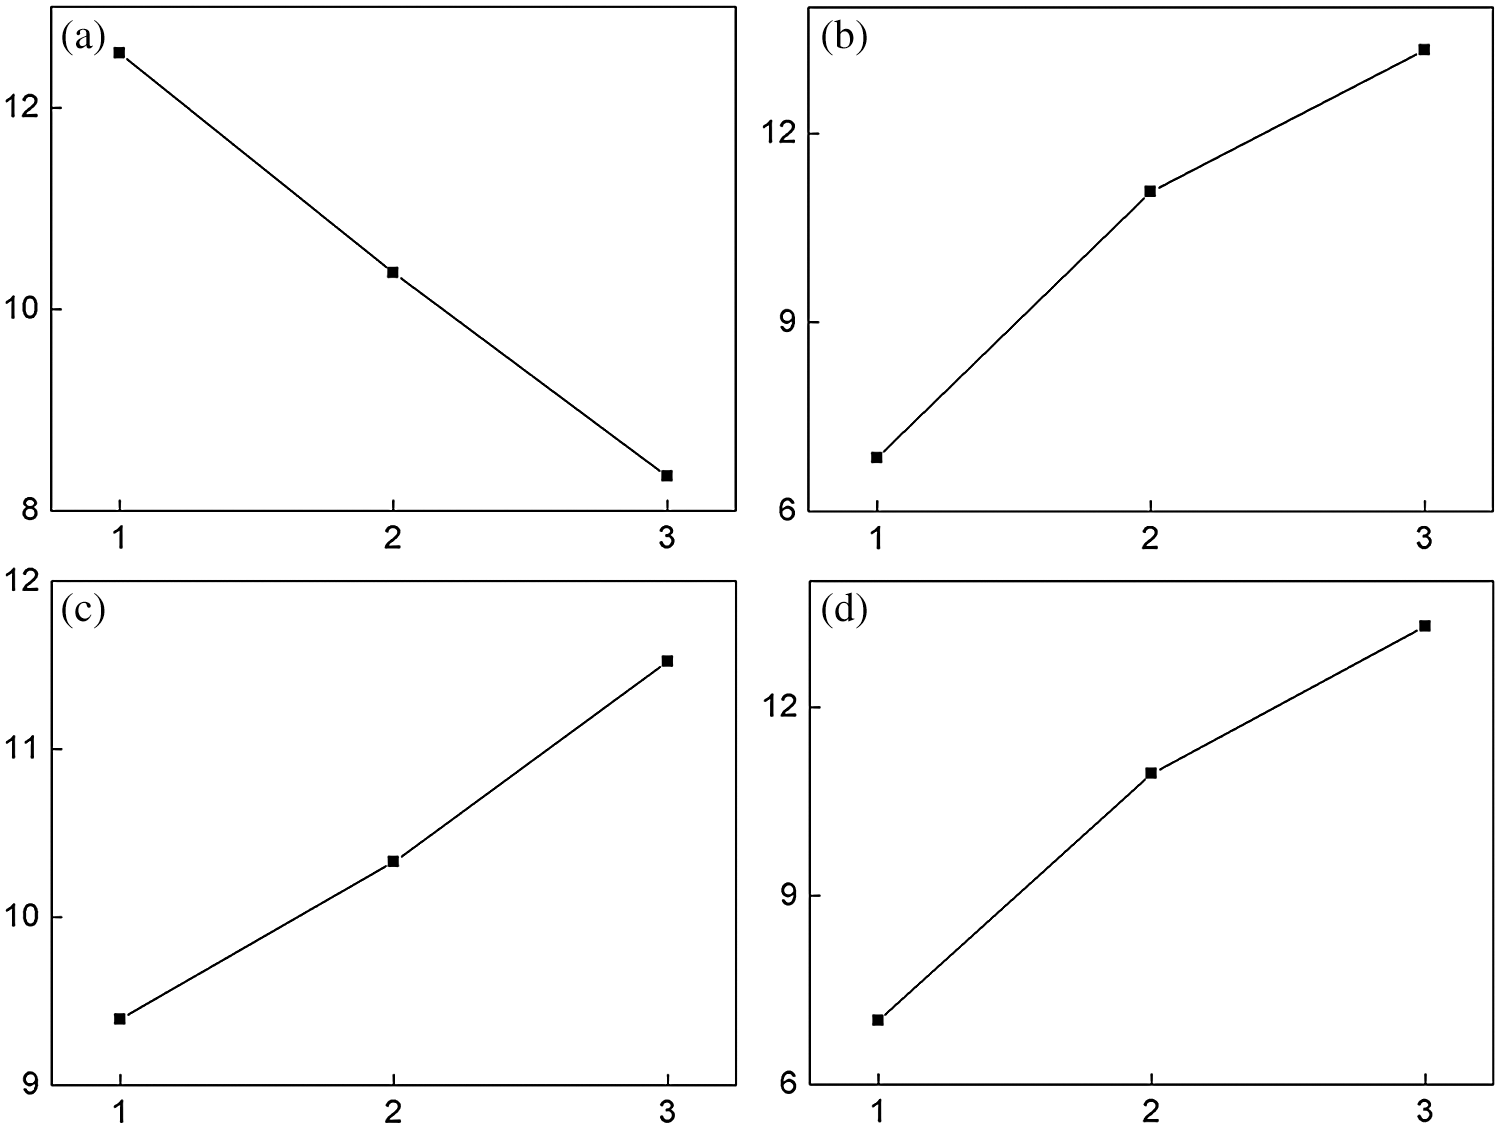
Figure 9: Influence of different levels of process parameter on porosity (the abscissa represents different levels; the ordinate represents the porosity, unit: %): (a) Laser power; (b) Scanning speed; (c) Hatch space; (d) Layer thickness
(B) The influence of different levels of process parameter on surface roughness
With reference to the above data analysis strategy, Fig. 10 shows the influences of different level parameters of laser power (Fig. 10a), scanning speed (Fig. 10b), hatch space (Fig. 10c) and layer thickness (Fig. 10d) on surface roughness. It can be seen from the data in Fig. 10 that the influence of laser power and scanning speed on surface roughness showed a trend of first decreasing and then increasing, while the influence of hatch space and layer thickness on surface roughness showed a monotonous increasing trend. Experimental research [50] also revealed the same law. The reason is that, on one hand, too low laser power and too high scanning speed meant that the laser energy applied to the powder bed per unit time was too little, and it was difficult to fully fuse metal particles to obtain a rough surface. Too high laser power and too low scanning speed meant that too much laser energy was applied to the powder bed per unit time, which caused the pinhole phenomenon and the Marangoni effect to be too significant, thereby obtaining an uneven solidified track surface. On the other hand, because the hatch space and layer thickness were not too small, as the hatch space and layer thickness gradually increased, the laser energy applied to a certain volume of the powder bed was reduced, and it was difficult to fully fuse the metal particles to obtain a rough surface.
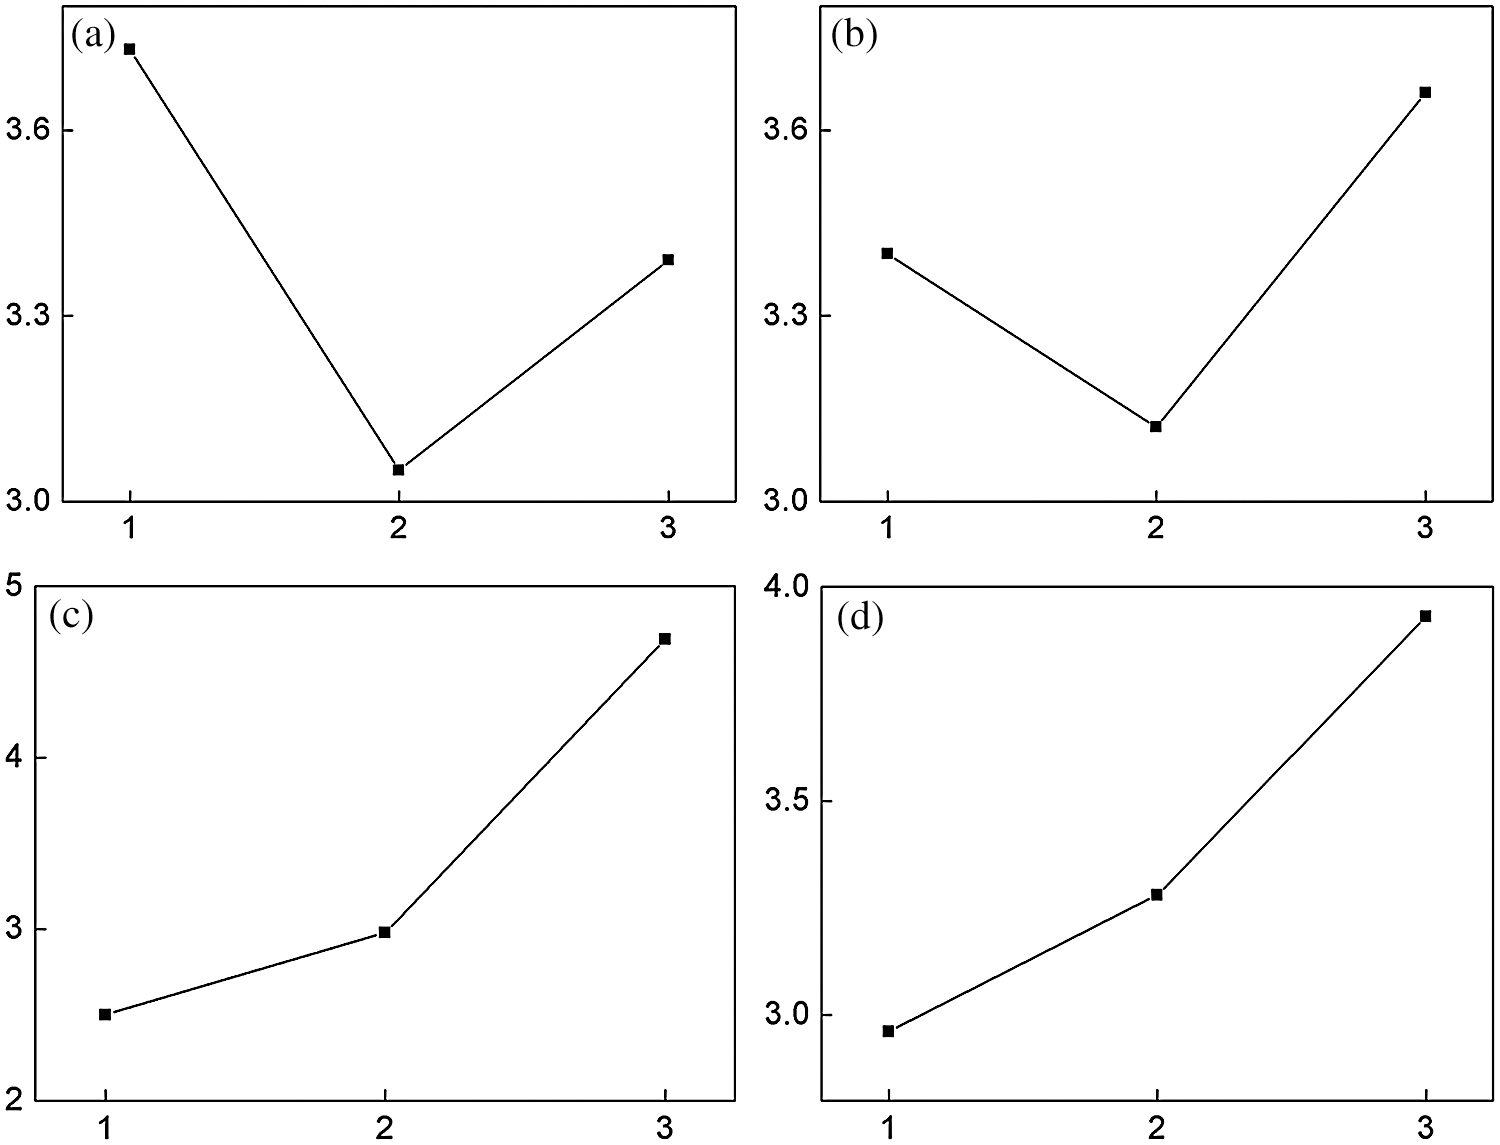
Figure 10: Influence of different levels of process parameter on surface roughness (the abscissa represents different levels; the ordinate represents the surface roughness, unit:  m): (a) Laser power; (b) Scanning speed; (c) Hatch space; (d) Layer thickness
(C) Degree of influence of each process parameter on porosity and surface roughness
Then, the degree of influence of each process parameter on porosity and surface roughness was analyzed, that is, comparing each process parameter horizontally, and ranking the influence of each process parameter on porosity and surface roughness. Taking the influence of laser power on porosity as an example, according to the data analysis strategy in the orthogonal experiment method, the range (the difference between the maximum value and the minimum value) in Fig. 9a could represent the influence of laser power on porosity. According to this strategy, the influence of each process parameter on porosity (Fig. 11a) and surface roughness (Fig. 11b) could be obtained. It can be seen from the data in Fig. 11 that the order of the influence of each process parameter on porosity is:  , and the order of the influence of each process parameter on surface roughness is:
  , that is, the porosity of the part is most sensitive to scanning speed, and the surface roughness of the part is the most sensitive to hatch space. The order of the influence of process parameters obtained herein was not consistent with [23]. The reason is that the degree of influence of each process parameter on porosity and surface roughness was closely related to the specific values of the parameters, and the ranges of the parameters’ values set herein were not completely consistent with the ranges of [23]. The above-mentioned data analysis conclusions help to provide a basis for process control for actual LPBF production of the 316L stainless steel alloy.
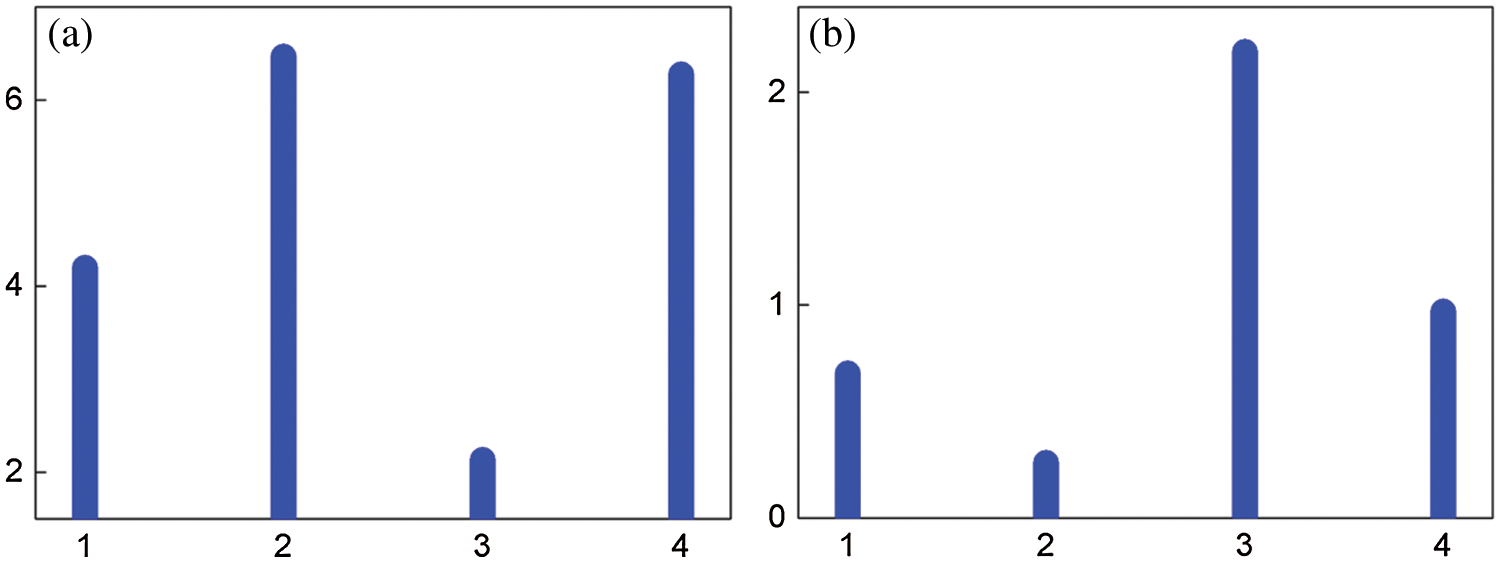
Figure 11: Degree of influence of each process parameter on porosity and surface roughness ( in the abscissa represent laser power, scanning speed, hatch space and layer thickness, respectively): (a) Porosity range under each process parameter (unit: %); (b) Surface roughness range under each process parameter (unit:
  m)
m)
1. Based on the open-source DEM framework Yade and the open-source FVM framework OpenFOAM, the multi-layer multi-path forming process of LPBF was predicted herein. In order to quantitatively analyze the influence of different process parameters (laser power, scanning speed, hatch space and layer thickness) on the LPBF process, based on the DOE method, a four-factor three-level orthogonal test scheme was designed, and the porosity and surface roughness data of each calculation scheme were extracted.
2. By analyzing the orthogonal test data, it was found that as the laser power increased, the porosity decreased, and as the scanning speed, hatch space, and layer thickness increased, the porosity increased. In addition, the influence of laser power and scanning speed on surface roughness showed a trend of decreasing first and then increasing, while the influence of hatch space and layer thickness on surface roughness showed a monotonous increasing trend.
3. The order of the influence of each process parameter on porosity is:  , and the order of the influence of each process parameter on surface roughness is:
  . The above conclusions are helpful to provide process control basis for actual LPBF production of the 316L stainless steel alloy.
Funding Statement: This work was supported by the Natural Science Foundation of Guangdong Province (No. 2019A1515012040).
Conflicts of Interest: The authors declare that they have no conflicts of interest to report regarding the present study.
1. Shipley, H., McDonnell, D., Culleton, M., Coull, R., Lupoi, R. et al. (2018). Optimisation of process parameters to address fundamental challenges during selective laser melting of Ti–6Al–4V: A review. International Journal of Machine Tools and Manufacture, 128, 1–20. DOI 10.1016/j.ijmachtools.2018.01.003. [Google Scholar] [CrossRef]
2. Fayazfar, H., Salarian, M., Rogalsky, A., Sarker, D., Russo, P. et al. (2018). A critical review of powder-based additive manufacturing of ferrous alloys: Process parameters, microstructure and mechanical properties. Materials and Design, 144, 98–128. DOI 10.1016/j.matdes.2018.02.018. [Google Scholar] [CrossRef]
3. Ni, X. Q., Kong, D. C., Zhang, L., Dong, C. F., Song, J. et al. (2019). Effect of process parameters on the mechanical properties of Hastelloy X alloy fabricated by selective laser melting. Journal of Materials Engineering and Performance, 28(9), 5533–5540. DOI 10.1007/s11665-019-04275-w. [Google Scholar] [CrossRef]
4. Calignano, F., Minetola, P. (2019). Influence of process parameters on the porosity, accuracy, roughness, and support structures of Hastelloy X produced by laser powder bed fusion. Materials, 12(19), 3178. DOI 10.3390/ma12193178. [Google Scholar] [CrossRef]
5. Terner, M., Ricordel, T., Cho, J. H., Lee, J. S. (2019). The response surface methodology for optimizing the process parameters of selective laser melting. Journal of Welding and Joining, 37(1), 27–39. DOI 10.5781/JWJ.2019.37.1.4. [Google Scholar] [CrossRef]
6. Liverani, E., Toschi, S., Ceschini, L., Fortunato, A. (2017). Effect of selective laser melting (SLM) process parameters on microstructure and mechanical properties of 316L austenitic stainless steel. Journal of Materials Processing Technology, 249, 255–263. DOI 10.1016/j.jmatprotec.2017.05.042. [Google Scholar] [CrossRef]
7. Baciu, A. M., Bejinariu, C., Corăbieru, A., Mihalache, E., Lupu-Poliac, M. et al. (2019). Influence of process parameters for selective laser melting on the roughness of 3D printed surfaces in Co-Cr dental alloy powder. Proceedings of IOP Conference Series: Materials Science and Engineering, 572, 012054. DOI 10.1088/1757-899X/572/1/012054. [Google Scholar] [CrossRef]
8. Bai, S. G., Perevoshchikova, N., Sha, Y., Wu, X. H. (2019). The effects of selective laser melting process parameters on relative density of the AlSi10Mg parts and suitable procedures of the archimedes method. Applied Sciences, 9(3), 583. DOI 10.3390/app9030583. [Google Scholar] [CrossRef]
9. Panwisawas, C., Qiu, C. L., Sovani, Y., Brooks, J. W., Attallah, M. M. et al. (2015). On the role of thermal fluid dynamics into the evolution of porosity during selective laser melting. Scripta Materialia, 105, 14–17. DOI 10.1016/j.scriptamat.2015.04.016. [Google Scholar] [CrossRef]
10. Jadhav, S. D., Dadbakhsh, S., Goossens, L., Kruth, J. P., Humbeeck, J. V. et al. (2019). Influence of selective laser melting process parameters on texture evolution in pure copper. Journal of Materials Processing Technology, 270, 47–58. DOI 10.1016/j.jmatprotec.2019.02.022. [Google Scholar] [CrossRef]
11. Wang, D., Yang, Y. Q., Su, X. B., Chen, Y. H. (2012). Study on energy input and its influences on single-track, multi-track, and multi-layer in SLM. International Journal of Advanced Manufacturing Technology, 58(9–12), 1189–1199. DOI 10.1007/s00170-011-3443-y. [Google Scholar] [CrossRef]
12. Kurzynowski, T., Chlebus, E., Kuźnicka, B., Reiner, J. (2012). Parameters in selective laser melting for processing metallic powders. Proceedings of SPIE, 8239, 823914. DOI 10.1117/12.907292. [Google Scholar] [CrossRef]
13. Wang, Q., Zhang, Z. H., Tong, X., Dong, S. Y., Cui, Z. Q. et al. (2020). Effects of process parameters on the microstructure and mechanical properties of 24CrNiMo steel fabricated by selective laser melting. Optics and Laser Technology, 128, 106262. DOI 10.1016/j.optlastec.2020.106262. [Google Scholar] [CrossRef]
14. Yang, T., Liu, T. T., Liao, W. H., MacDonald, E., Wei, H. L. et al. (2019). The influence of process parameters on vertical surface roughness of the AlSi10Mg parts fabricated by selective laser melting. Journal of Materials Processing Technology, 266, 26–36. DOI 10.1016/j.jmatprotec.2018.10.015. [Google Scholar] [CrossRef]
15. Mugwagwa, L., Yadroitsev, I., Matope, S. (2019). Effect of process parameters on residual stresses, distortions, and porosity in selective laser melting of maraging steel 300. Metals, 9(10), 1042. DOI 10.3390/met9101042. [Google Scholar] [CrossRef]
16. Sun, D. S., Gu, D. D., Lin, K. J., Ma, J., Chen, W. H. et al. (2019). Selective laser melting of titanium parts: Influence of laser process parameters on macro- and microstructures and tensile property. Powder Technology, 342, 371–379. DOI 10.1016/j.powtec.2018.09.090. [Google Scholar] [CrossRef]
17. Maamoun, A. H., Xue, Y. F., Elbestawi, M. A., Veldhuis, S. C. (2018). Effect of selective laser melting process parameters on the quality of al alloy parts: Powder characterization, density, surface roughness, and dimensional accuracy. Materials, 11(12), 2343. DOI 10.3390/ma11122343. [Google Scholar] [CrossRef]
18. Gu, H. F., Gong, H. J., Pal, D., Rafi, K., Starr, T. et al. (2013). Influences of energy density on porosity and microstructure of selective laser melted 17-4PH stainless steel. Proceedings of the Solid Freeform Fabrication Symposium, Austin, TX, USA. [Google Scholar]
19. Palousek, D., Kocica, M., Pantelejev, L., Klakurkova, L., Celko, L. et al. (2019). SLM process parameters development of Cu-alloy Cu7.2Ni1.8Si1Cr. Rapid Prototyping Journal, 25(2), 266–276. DOI 10.1108/RPJ-06-2017-0116. [Google Scholar] [CrossRef]
20. Liu, S., Yang, W. S., Shi, X., Li, B., Duan, S. C. et al. (2019). Influence of laser process parameters on the densification, microstructure, and mechanical properties of a selective laser melted AZ61 magnesium alloy. Journal of Alloys and Compounds, 808, 151160. DOI 10.1016/j.jallcom.2019.06.261. [Google Scholar] [CrossRef]
21. Khorasani, A., Gibson, I., Awan, U. S., Ghaderi, A. (2019). The effect of SLM process parameters on density, hardness, tensile strength and surface quality of Ti-6Al-4V. Additive Manufacturing, 25, 176–186. DOI 10.1016/j.addma.2018.09.002. [Google Scholar] [CrossRef]
22. Tonelli, L., Liverani, E., Valli, G., Fortunato, A., Ceschini, L. (2020). Effects of powders and process parameters on density and hardness of A357 aluminum alloy fabricated by selective laser melting. International Journal of Advanced Manufacturing Technology, 106(1–2), 371–383. DOI 10.1007/s00170-019-04641-x. [Google Scholar] [CrossRef]
23. Jiang, H. Z., Li, Z. Y., Feng, T., Wu, P. Y., Chen, Q. S. et al. (2019). Factor analysis of selective laser melting process parameters with normalised quantities and Taguchi method. Optics and Laser Technology, 119, 105592. DOI 10.1016/j.optlastec.2019.105592. [Google Scholar] [CrossRef]
24. Liu, B. Q., Fang, G., Lei, L. P., Liu, W. (2020). A new ray tracing heat source model for mesoscale CFD simulation of selective laser melting (SLM). Applied Mathematical Modelling, 79, 506–520. DOI 10.1016/j.apm.2019.10.049. [Google Scholar] [CrossRef]
25. Tang, C., Tan, J. L., Wong, C. H. (2018). A numerical investigation on the physical mechanisms of single track defects in selective laser melting. International Journal of Heat and Mass Transfer, 126, 957–968. DOI 10.1016/j.ijheatmasstransfer.2018.06.073. [Google Scholar] [CrossRef]
26. Wang, Y. H., Chen, X. Z., Jayalakshmi, S., Singh, R. A., Sergey, K. et al. (2020). Process parameters, product quality monitoring, and control of powder bed fusion. Transactions on Intelligent Welding Manufacturing, 3, 89–108. 10.1007/978-981-13-8192-8. [Google Scholar] [CrossRef]
27. Song, X., Feih, S., Zhai, W., Sun, C. N., Li, F. et al. (2020). Advances in additive manufacturing process simulation: Residual stresses and distortion predictions in complex metallic components. Materials and Design, 193, 108779. DOI 10.1016/j.matdes.2020.108779. [Google Scholar] [CrossRef]
28. Gordeev, G. A., Ankudinov, V., Kharanzhevskiy, E. V., Krivilyov, M. D. (2020). Numerical simulation of selective laser melting with local powder shrinkage using FEM with the refined mesh. European Physical Journal Special Topics, 229(2–3), 205–216. DOI 10.1140/epjst/e2019-900100-6.
29. Cao, L. (2020). Mesoscopic-scale Numerical Simulation including the influence of process parameters on SLM single-layer multi-pass formation. Metallurgical and Materials Transactions A, 51(8), 4130–4145. DOI 10.1007/s11661-020-05831-z. [Google Scholar] [CrossRef]
30. Jiang, X. H., Ye, T., Zhu, Y. H. (2020). Effect of process parameters on residual stress in selective laser melting of AlSi10Mg. Materials Science and Technology, 36(3), 342–352. DOI 10.1080/02670836.2019.1705560. [Google Scholar] [CrossRef]
31. Orlov, A., Borisov, E., Popovich, A. (2020). Numerical simulation of the selective laser melting process using the example of a turbine blade. Materials Science Forum, 989, 850–855. DOI 10.4028/www.scientific.net/MSF.989.850.
32. Chen, X. B., Sun, Q., Sun, Q. P., Wu, H. B., Xu, Q. (2020). Simulation on molten pool characteristics of Al2O3 laser selective melting based on energy input model. Proceedings of International Conference on Optoelectronic Science and Materials, Hefei, Anhui, China, 711, 012102.
33. Cao, L. (2020). Workpiece-scale numerical simulations of SLM molten pool dynamic behavior of 316L stainless steel. Computers and Mathematics with Applications, DOI 10.1016/j.camwa.2020.04.020.
34. Schänzel, M., Shakirov, D., Ilin, A., Ploshikhin, V. (2019). Coupled thermo-mechanical process simulation method for selective laser melting considering phase transformation steels. Computers and Mathematics with Applications, 78(7), 2230–2246. DOI 10.1016/j.camwa.2019.01.019.
35. Cao, L., Yuan, X. F. (2019). Study on the numerical simulation of the slm molten pool dynamic behavior of a nickel-based superalloy on the workpiece scale. Materials, 12(14), 2272. DOI 10.3390/ma12142272. [Google Scholar] [CrossRef]
36. Dong, Z. C., Li, W. J., Zhang, Q., Liu, Y. B., Ge, J. R. et al. (2020). Evaluation for multiple processing parameters in selective laser melting based on an integration of mesoscale simulation and experiment method. Journal of Physics D: Applied Physics, 53(14), 145501. DOI 10.1088/1361-6463/ab651f. [Google Scholar] [CrossRef]
37. Cao, L. (2020). Mesoscopic-scale simulation of pore evolution during laser powder bed fusion process. Computational Materials Science, 179, 109686. DOI 10.1016/j.commatsci.2020.109686.
38. Wang, Z. K., Yan, W. T., Liu, W. K., Liu, M. B. (2019). Powder-scale multi-physics modeling of multi-layer multi-track selective laser melting with sharp interface capturing method. Computational Mechanics, 63(4), 649–661. DOI 10.1007/s00466-018-1614-5.
39. Cao, L. (2019). Study on the numerical simulation of laying powder for selective laser melting process. International Journal of Advanced Manufacturing Technology, 105(5–6), 2253–2269. DOI 10.1007/s00170-019-04440-4. [Google Scholar] [CrossRef]
40. Gu, D. D., Xia, M. J., Dai, D. H. (2019). On the role of powder flow behavior in fluid thermodynamics and laser processability of Ni-based composites by selective laser melting. International Journal of Machine Tools and Manufacture, 137, 67–78. DOI 10.1016/j.ijmachtools.2018.10.006.
41. Cao, L. (2019). Numerical simulation of the impact of laying powder on selective laser melting single-pass formation. International Journal of Heat and Mass Transfer, 141, 1036–1048. DOI 10.1016/j.ijheatmasstransfer.2019.07.053. [Google Scholar] [CrossRef]
42. Liu, D. H., Wang, Y. (2020). Multiphysics simulation of nucleation and grain growth in selective laser melting of alloys. Journal of Computing and Information Science in Engineering, 20(5), 051002. DOI 10.1115/1.4046543. [Google Scholar] [CrossRef]
43. Dubrov, A. V., Mirzade, F. K., Dubrov, V. D. (2019). On the dendrite growth simulation during multitrack selective laser melting process. Journal of Physics: Conference Series, 1410, 012026. DOI 10.1088/1742-6596/1410/1/012026. [Google Scholar] [CrossRef]
44. Yuan, W. H., Chen, H., Cheng, T., Wei, Q. S. (2020). Effects of laser scanning speeds on different states of the molten pool during selective laser melting: Simulation and experiment. Materials and Design, 189, 108542. DOI 10.1016/j.matdes.2020.108542. [Google Scholar] [CrossRef]
45. Peng, L. P., Jiang, H. S., Chen, X. H., Liu, D. Y., Feng, H. H. et al. (2019). A review on the advanced design techniques and methods of vibrating screen for coal preparation. Powder Technology, 347, 136–147. DOI 10.1016/j.powtec.2019.02.047. [Google Scholar] [CrossRef]
46. Cao, L., Liao, D. M., Sun, F., Chen, T., Teng, Z. H. et al. (2017). Prediction of gas entrapment defects during zinc alloy high-pressure die casting based on gas-liquid multiphase flow model. International Journal of Advanced Manufacturing Technology, 94(1–4), 807–815. DOI 10.1007/s00170-017-0926-5. [Google Scholar] [CrossRef]
47. Cao, L., Sun, F., Chen, T., Teng, Z. H., Tang, Y. L. et al. (2017). Numerical simulation of liquid-solid conversion affecting flow behavior during casting filling process. Acta Metallurgica Sinica, 53(11), 1521–1531. [Google Scholar]
48. Khairallah, S. A., Martin, A. A., Lee, J. R. I., Guss, G., Calta, N. P. et al. (2020). Controlling interdependent meso-nanosecond dynamics and defect generation in metal 3D printing. Science, 368(6491), 660–665. DOI 10.1126/science.aay7830. [Google Scholar] [CrossRef]
49. Guo, Q. L., Zhao, C., Escano, L. I., Young, Z., Xiong, L. H. et al. (2018). Transient dynamics of powder spattering in laser powder bed fusion additive manufacturing process revealed by in-situ high-speed high energy x-ray imaging. Acta Materialia, 151, 169–180. DOI 10.1016/j.actamat.2018.03.036. [Google Scholar] [CrossRef]
50. Qiu, C. L., Panwisawas, C., Ward, M., Basoalto, H. C., Brooks, J. W. et al. (2015). On the role of melt flow into the surface structure and porosity development during selective laser melting. Acta Materialia, 96, 72–79. DOI 10.1016/j.actamat.2015.06.004. [Google Scholar] [CrossRef]
51. Bai, Y. C., Yang, Y. Q., Wang, D., Zhang, M. K. (2017). Influence mechanism of parameters process and mechanical properties evolution mechanism of maraging steel 300 by selective laser melting. Materials Science & Engineering A, 703, 116–123. DOI 10.1016/j.msea.2017.06.033. [Google Scholar] [CrossRef]
 | This work is licensed under a Creative Commons Attribution 4.0 International License, which permits unrestricted use, distribution, and reproduction in any medium, provided the original work is properly cited. |