| Computer Modeling in Engineering & Sciences |
DOI: 10.32604/cmes.2021.011556
ARTICLE
Analysis of a Water-Inrush Disaster Caused by Coal Seam Subsidence Karst Collapse Column under the Action of Multi-Field Coupling in Taoyuan Coal Mine
1School of Civil Engineering, Henan Polytechnic University, Jiaozuo, 454000, China
2School of Energy Science and Engineering, Henan Polytechnic University, Jiaozuo, 454000, China
*Corresponding Author: Boyang Zhang. Email: zhangboyangzzdq@126.com
Received: 16 May 2020; Accepted: 17 August 2020
Abstract: Minin-induced water inrush from a confined aquifer due to subsided floor karst collapse column (SKCC) is a type of serious disaster in the underground coal extraction. Karst collapse column (KCC) developed in a confined aquifer occurs widely throughout northern China. A water inrush disaster from SKCC occurred in Taoyuan coal mine on February 3, 2013. In order to analyze the effect of the KCC influence zone’s (KCCIZ) width and the entry driving distance of the water inrush through the fractured channels of the SKCC, the stress, seepage, and impact dynamics coupling equations were used to model the seepage rule, and a numerical FLAC3D model was created to determine the plastic zones, the vertical displacement development of the rock mass surrounding the entry driving working face (EDWF), and the seepage vector and water inflow development of the seepage field. The hysteretic mechanism of water inrush due to SKCC in Taoyuan coal mine was investigated. The results indicate that a water inrush disaster will occur when the width of the KCCIZ exceeds 16 m under a driving, which leads to the aquifer connecting with the fractured zones of the entry floor. Hysteretic water inrush disasters are related to the stress release rate of the surrounding rocks under the entry driving. When the entry driving exceeds about 10 m from the water inrush point, the stress release rate reaches about 100%, and a water inrush disaster occurs.
Keywords: Karst collapse column; multi-field coupling; seepage mutation; water-inrush
Water inrush in coal mines has resulted in millions of fatalities in China. With the development of new technology, the level of coal production and construction has significantly improved [1]. However, with the gradual depletion of shallow coal resources, the deep, high intensity mining brings great challenges to mine water disaster prevention and control in China. Groundwater inrush accidents still frequently occur and exceed 90% of the accidental inundations due to water inflow from karst aquifers through the coal seam floor [2]. For example, a water inrush disaster occurred in Taoyuan coal mine due to the high water inflow (29,000 m3/h) from a karst aquifer through coal floor subsided karst collapse column (SKCC) at 00:20 on February 3, 2013 [3,4].
Karst collapse column (KCC) is a special geological structure that is widely distributed in northern China. It is composed of fillings such as broken rocks and fine argillaceous or clay particles, and it causes the surrounding rock mass to settle and develop a large number of fissures [5–8]. In the process of coal mining in these areas, fissure channels easily form between the coal seam working face and the karst aquifer (Fig. 1), thereby causing water inrush disasters that result in the loss of underground water resources, economic losses, and casualties [9–11]. KCC water inrush in coal mines has the characteristics of suddenness, hysteresis, and concealment, so it is difficult to carry out early warning and prevention [12,13]. Unlike the seepage of fractured rock [14], the interior of a KCC with a water inrush risk is mainly composed of broken rock. In order to study the characteristics of KCC water inrush, a large number of theoretical and numerical models have been established. Yao et al. [15,16] constructed a fluid–solid coupling model to analyze the groundwater inrush mechanisms of KCC. To investigate the mechanism of groundwater inrush from a coal seam floor, Bai et al. [17] introduced variable mass dynamics and nonlinear dynamics and established a mechanical model-plug model to describe the behavior of water seepage flow through a coal seam floor containing KCC. To investigate the effect of mining on shear sidewall groundwater inrush hazards caused by seepage instability of a penetrated KCC, Ma et al. [18,19] established stress and seepage coupling equations to model mining-induced seepage.
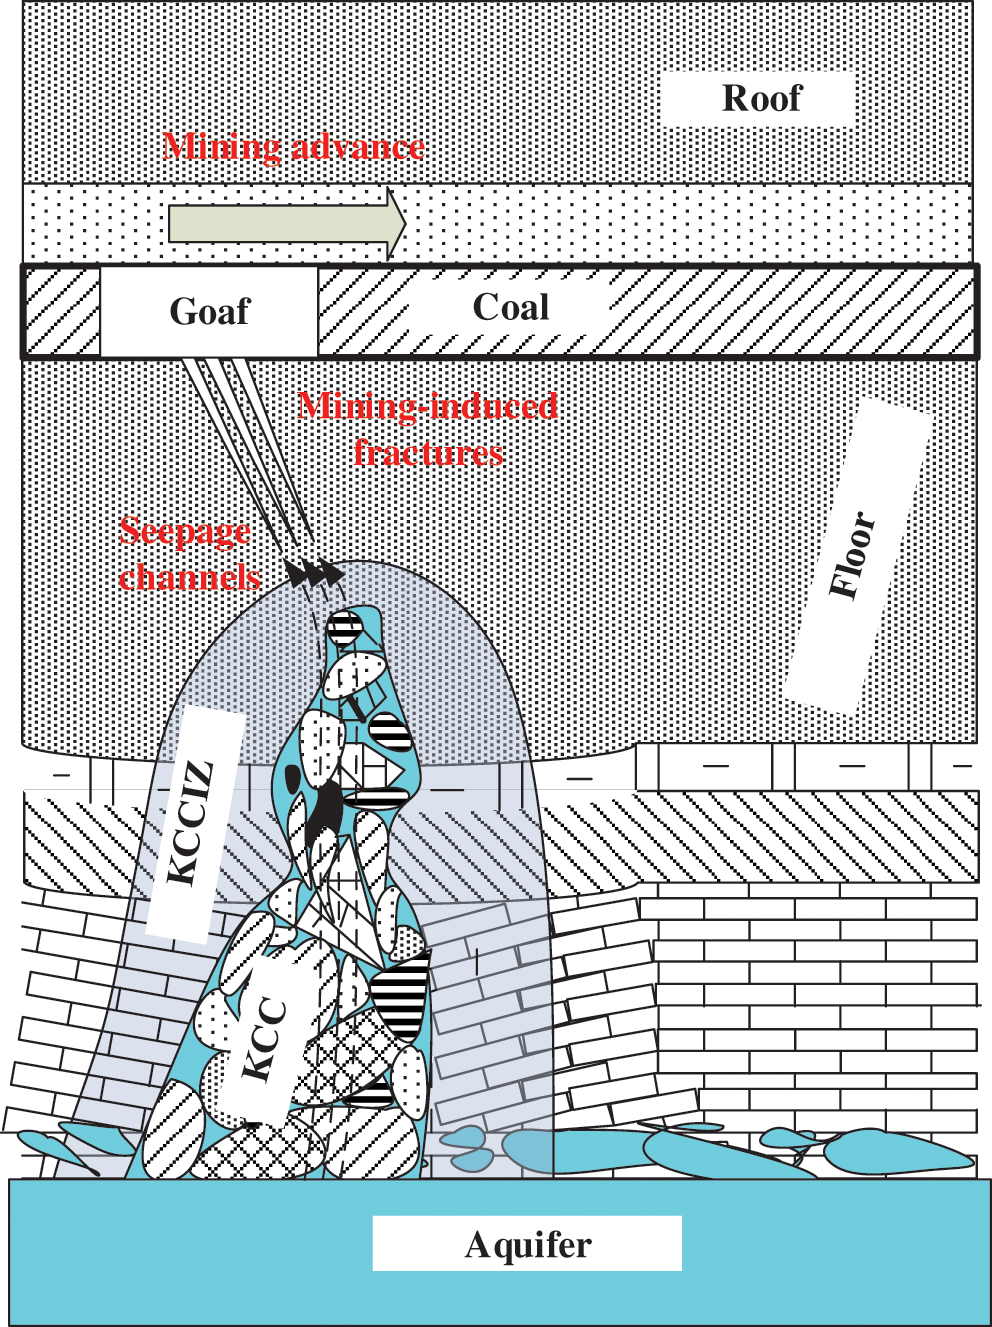
Figure 1: The KCCIZ around the KCC
Previous studies have provided strong theoretical support for the prevention and control of KCC water inrush disasters and have obtained significant engineering benefit. In the KCC water inrush in Taoyuan coal mine, the entire mine was flooded, but there was only one casualty. However, in the period of karst cavity formation and closed geological structure evolution, the ground stress and rock stratum of the KCC are destroyed and affected. Generally, the cavity of a KCC is broken, stress is released, and cracks appear around the cavity and in the roof rock, forming a KCC influence zone (KCCIZ) around the KCC (Fig. 1). Under the action of water immersion, the strength of the KCCIZ is low, and its development width is generally about 5–30 m. It is a very dangerous structural influence zone, which plays a major role in controlling mine water inrush [20–22].
In order to analyze the KCC water inrush in Taoyuan coal mine, based on research into the mining method and the KCC water inrush mechanism, a numerical model that considers the dynamic changes in the strain softening and rock mass permeability coefficient was established. FLAC numerical investigations were conducted to investigate the stress, displacement, and failure zone under the condition of a variable width KCCIZ and mining induced floor fractures. In addition, the influence of the dynamic cutting tunneling process on hysteresis water inrush due to SKCC was studied by changing the stress release rate of the surrounding rock.
2 Water Inrush Disaster Situation
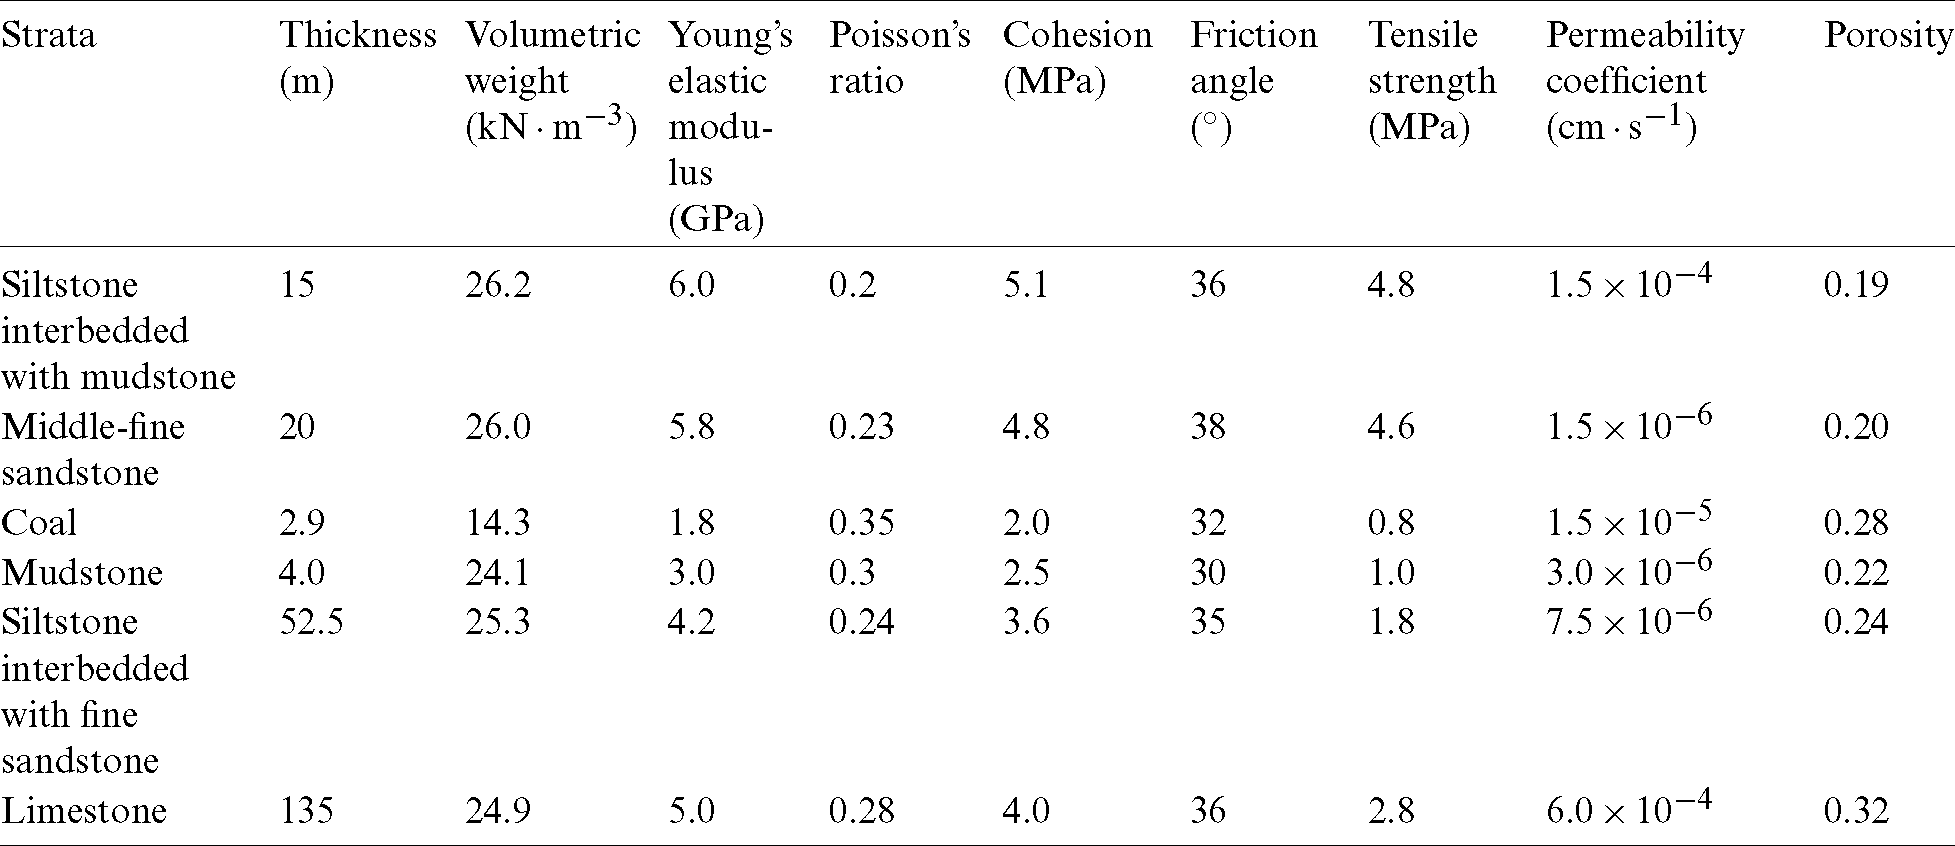
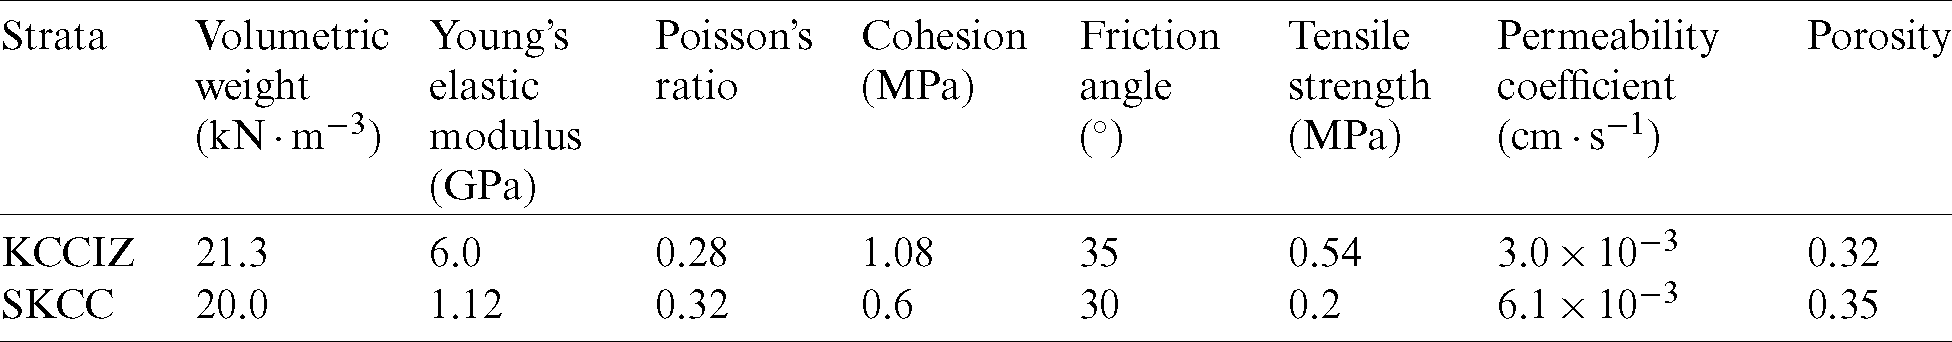
Taoyuan coal mine is located in Suzhou, Anhui Province, China, and working face 1035 is located in the third stage of the south wing of the south three mining area. The main coal seam is coal seam #10, which is 2.9 m thick and has an average burial depth of about 500 m. The SKCC water inrush disaster occurred in the entry driving working face (EDWF) of working face 1035. The EDWF was driven along the roof of coal seam #10, and explosion driving and bolt-mesh support were both employed. The cross-section is rectangular, with a width and height of 3.8 m and 2.8 m, respectively (Fig. 2). The entry roof is composed of medium-fine sandstone and siltstone with mudstone, and the entry floor is composed of dense mudstone, interbedded silt-fine sandstone with well-developed fractures, and limestone with well-developed fractures. The basic mechanical and seepage parameters of the rock strata in each layer are presented in Tab. 1.
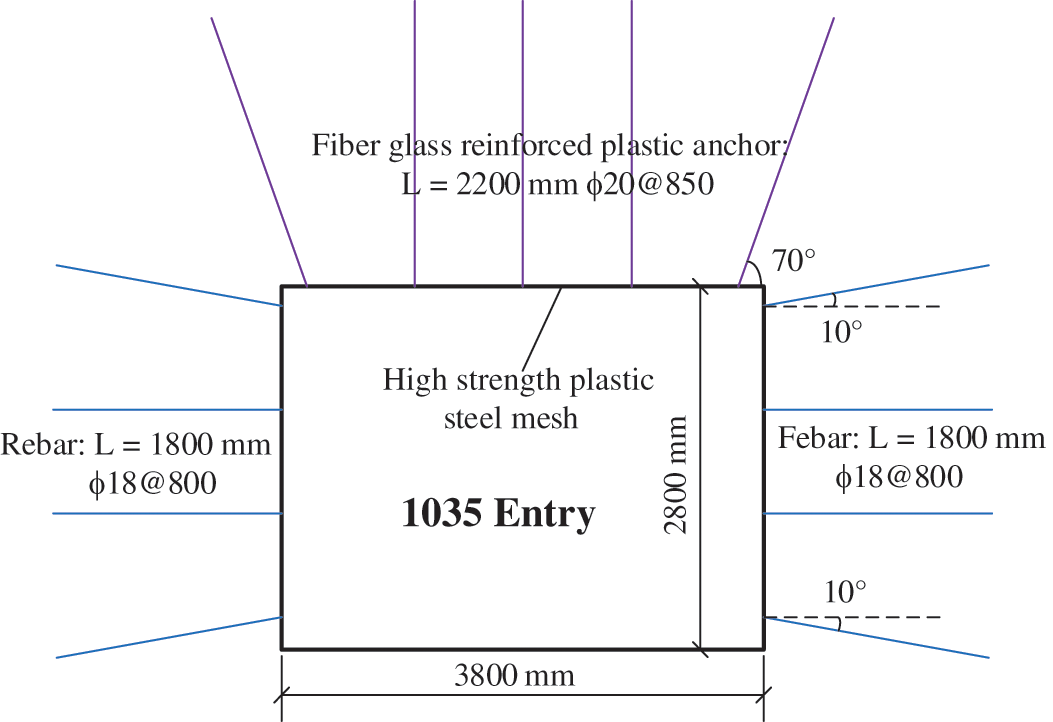
Figure 2: Support cross section of entry 1035
Table 1: Mechanical and seepage parameters of the rock strata surrounding the entry
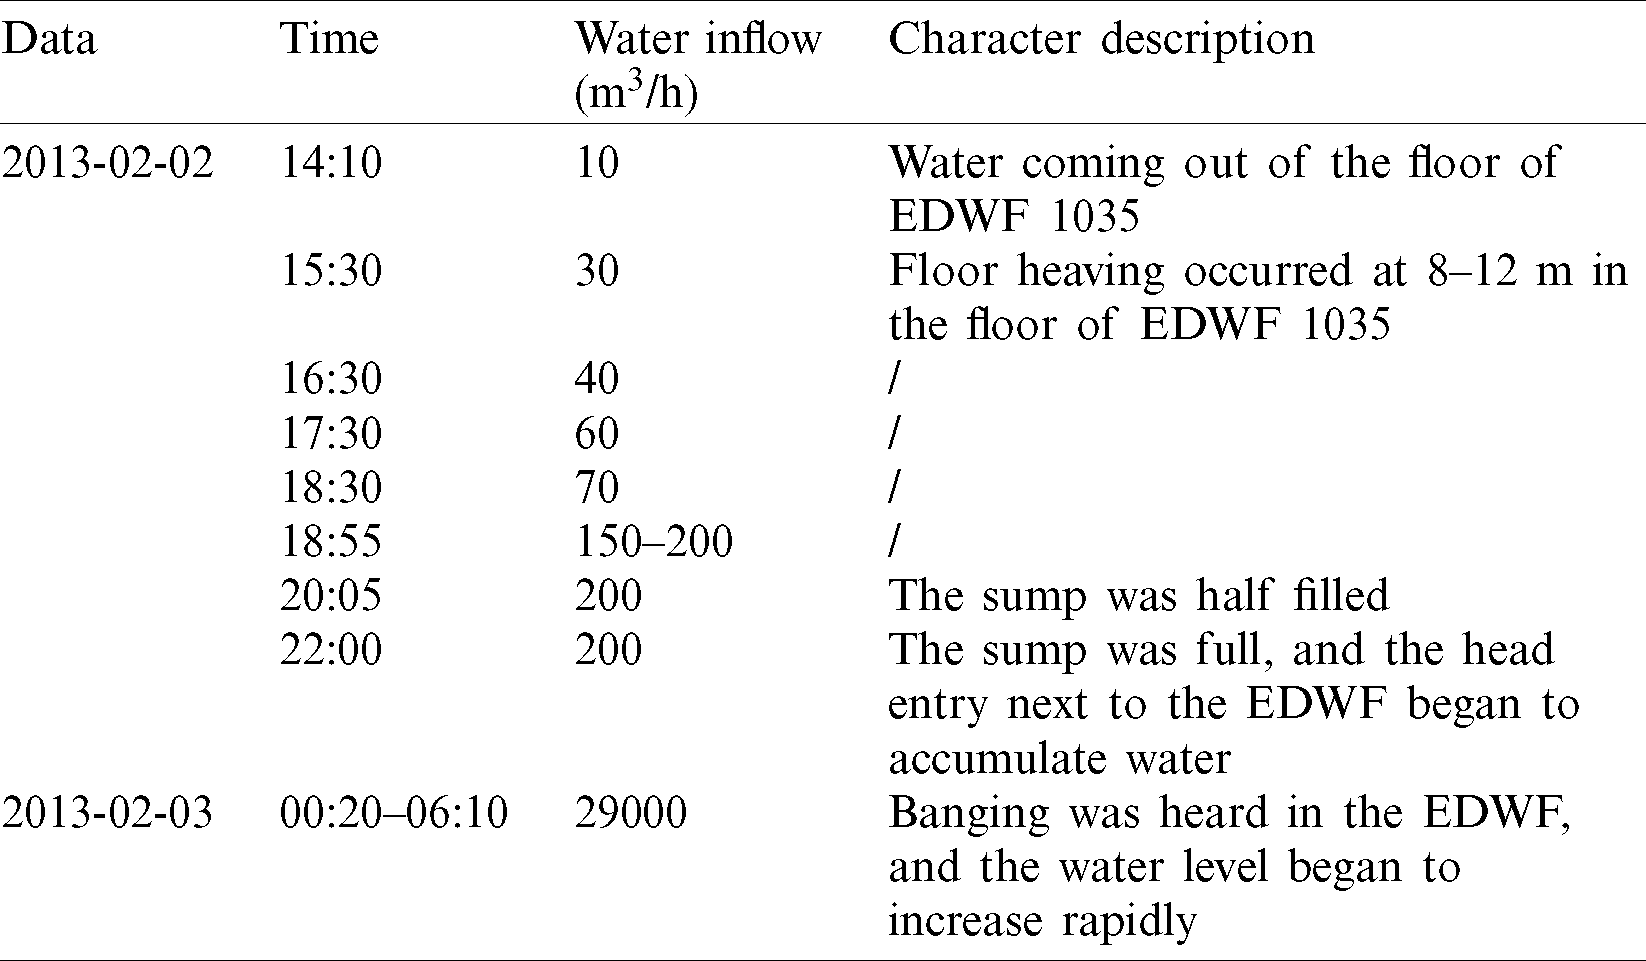
On February 2, 2013, a water inrush accident occurred at EDWF 1035 in Taoyuan coal mine, which was accompanied by floor heave and increasing water inflow (Tab. 2).
Table 2: Description of the water inrush process from SKCC in Taoyuan mine
The water plugging drilling confirmed that the main water inrush channel was an SKCC (oval, long axis is 70 m, and short axis is 50 m), which was 20 m below the coal seam #10, and the water inrush point was located between the head roadway and the EDWF. There were two hydrology observation holes near the water inrush point, namely, the Ordovician limestone aquifer observation borehole (borehole #1) and the Permian limestone aquifer observation borehole (borehole #2), located at about 4 km and 1 km to the north of the water inrush point, respectively. After the disaster occurred, the water level in borehole #1 decreased by 58.12 m and that in borehole #2 only decreased by 16.5 m, which indicates that the main water inrush source was the Ordovician limestone water aquifer.
According to previous research results [23,24], the distribution regularity of the plastic zone in the rocks surrounding the rectangular entry is equivalent to that of a circular entry with the same diameter as its circumferential circle, and the plastic zone radius of a circular entry can be estimated as follows:
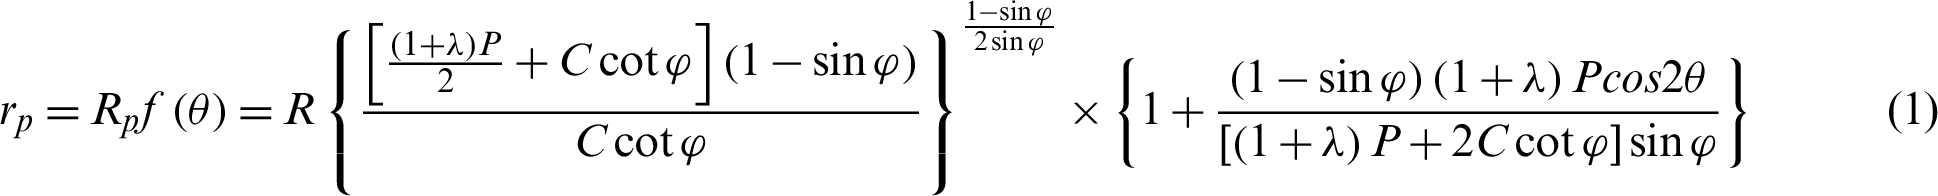
where P is the vertical stress;  is the lateral pressure coefficient; C is the cohesion of the surrounding rock;
  is the internal friction angle of the surrounding rock; and
  is the azimuth of the rock mass. Assuming that P is 12 MPa,
  is 1.5, C is 3.0 MPa, and
  is
is  , then the depth of the plastic zone in the coal seam floor is about 5.6 m.
The distance between the coal seam floor and the Ordovician limestone roof was 195 m, and there was almost no threat of water inrush damage without the influence of the faulted geological structure. However, the SKCC linking the Ordovician limestone aquifer was about 20 m below the coal seam floor, and the pore water pressure in the SKCC was about 4.3 MPa, which greatly increased the water inrush damage threat of the Ordovician limestone aquifer. However, in the process of a SKCC water inrush disaster, there must be a seepage channel between the SKCC and the coal seam floor, which may be composed of a floor failure zone and a KCCIZ (Fig. 1).
Therefore, the water inrush mechanism in the “2.3” Taoyuan coal mine disaster was as follows. As the driving of the EDWF, the rock mass behind the EDWF was continuously unloaded under high stress, generating a large number of mining-induced fractures. When these new fractures connected with the seepage fissure channels in the KCCIZ, the high-pressure water in the Ordovician limestone aquifer lead to water inrush through the SKCC, the KCCIZ, and the mining-induced fractures in turn. At the same time, during the water inrush, the water inrush channels were continuously widened under the action of hydraulic erosion, which further intensified the water inrush, resulting in well flooding (Fig. 3).
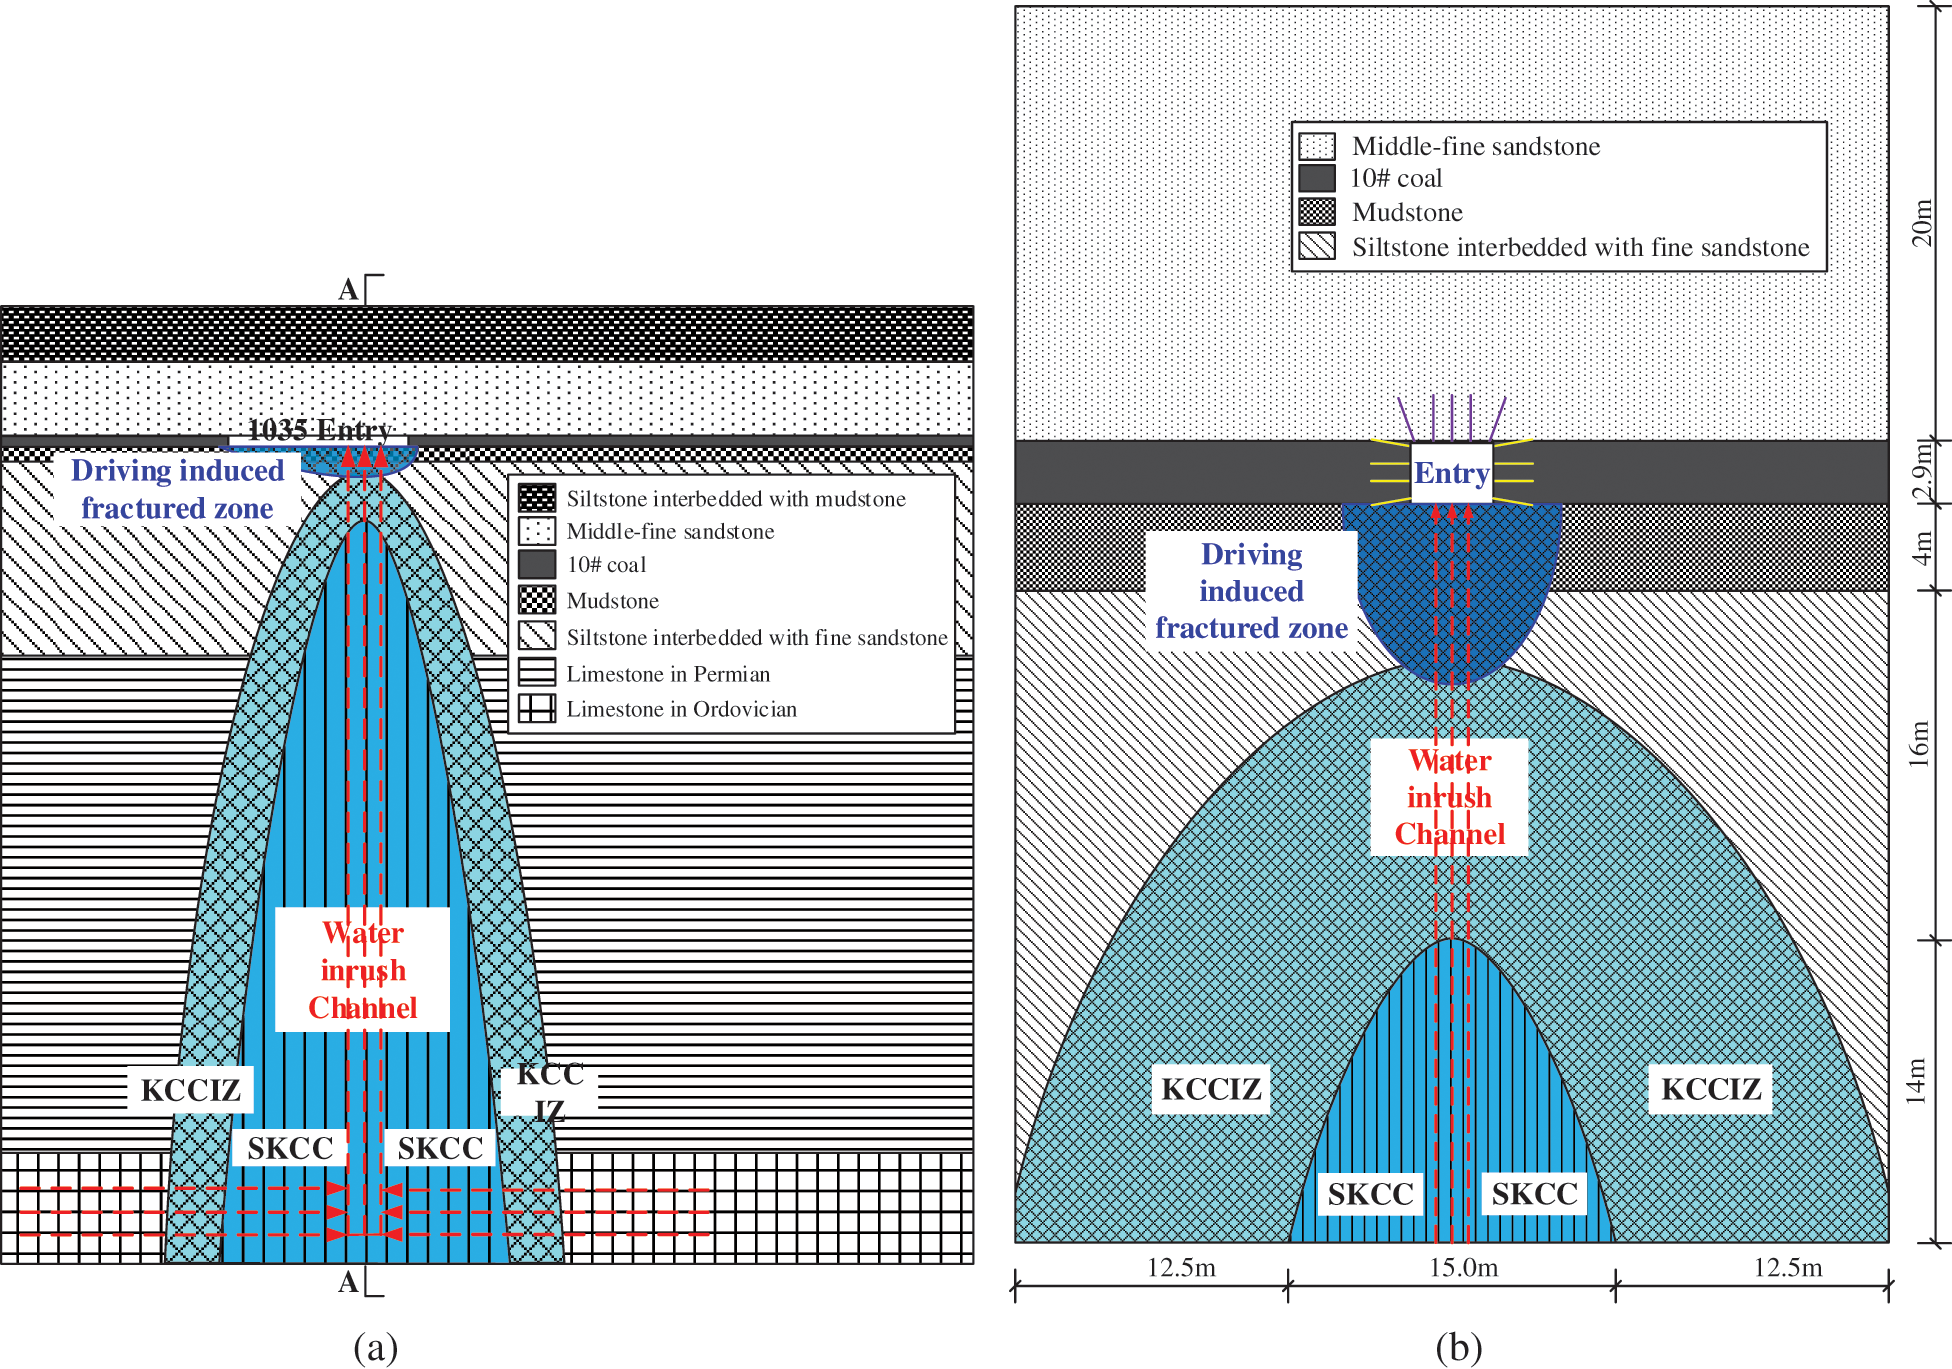
Figure 3: Water inrush from SKCC in entry 1035. (a) Vertical section. (b) Cross section A–A
3 Fluid–Solid Coupling Equation and Explosion Driving Pressure
3.1 Fluid–Solid Coupling Equation
Considering that the rock mass around the entry will yield after driving, which decreases the bearing capacity, a three-line strain softening model was adopted to simulate the relationship between the stress and strain of the surrounding rock (Fig. 4). It was considered to be in the elastic stage before the stress on the surrounding rock reached the peak strength, and its cohesion and internal friction angle remained unchanged. When the surrounding rock reached the peak strength, the stress–strain curve of the surrounding rock began to enter the strain softening stage, and its cohesion decreased linearly as the plastic shear strain increased, while the change in the internal friction angle was neglected [25]. When the plastic strain reached a certain degree, the stress–strain curve of the surrounding rock entered the post-peak residual stage, and its cohesion and internal friction angle remained unchanged again. According to the results of triaxial compression experiments on variable rock masses conducted in previous studies [26,27], based on the data shown in Tab. 1, the residual plastic strain of the middle-fine sandstone, coal, mudstone, and siltstone interbedded with fine sandstone was 1.6%, 2.0%, 3.0%, and 1.8%, respectively. However, the residual cohesions of the middle-fine sandstone, coal, mudstone, and siltstone interbedded with fine sandstone were taken to be 30%, 35%, 40%, and 30%, respectively, before the peak. In addition, the rock mass in the SKCC and KCCIZ was broken, so its properties were similar to those of hard soil under a high confining pressure. The Mohr-Coulomb model was adopted in the simulation. The mechanical and seepage parameters of the SKCC and KCCIZ are shown in Tab. 3.
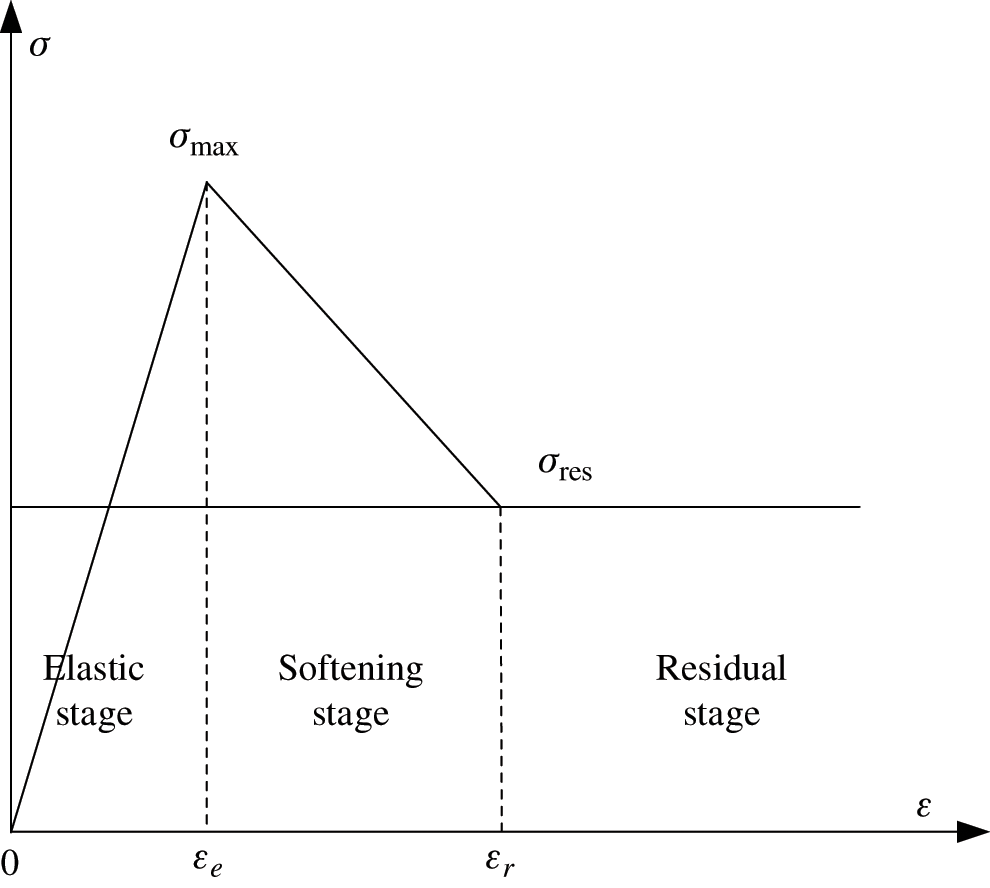
Figure 4: Strain softening constitutive model of the surrounding rock
Table 3: Mechanical and seepage parameters of the SKCC and KCCIZ
After strain softening occurs in the rock, the rock will be damaged by the development of fine fractures. The rock damage model based on the strain softening and residual strength modification is as follows:

where D is the damage factor of the rock mass; C0 is the cohesion of the rock mass before failure; and Cr is the cohesion of the rock mass in the post-peak residual stage.
In the process of rock mass strain softening, permeability is correlated with the damage evolution trend of the rock mass. The relationship between the damage factor D and the permeability k under a specific confining pressure can be expressed as an exponential function [28]:

where k is the permeability of the rock mass; k0 is the initial permeability of the rock mass; D0 is the threshold value of the damage’s influence on the permeability of the rock mass (when rock damage has no effect on permeability, D0 is 0); and A is a constant related to the rock’s characteristics and confining pressure (the values for the middle-fine sandstone, coal, mudstone, and siltstone interbedded with fine sandstone are 5.8, 5.7, 5.3, and 5.8, respectively).
There is a power function relationship between the porosity and the permeability of the rock mass [29]:

where n is the porosity of the rock mass, n0 is the initial porosity of the rock mass, and b is a material constant (the values for the middle-fine sandstone, coal, mudstone, and siltstone interbedded with fine sandstone are 9.6, 8.8, 7.5, and 9.3, respectively).
In FLAC [30], the permeability of a zone does not change with the stress or strain of the zone. In order to simulate the fluid–solid coupling relationship of the rock mass under mining, the relationship between the permeability and stress or strain must be established manually. Therefore, Eqs. (2)–(4) were jointly embedded into FLAC
 using the fish language to establish the relationship between the permeability and strain, that is, the permeability of the rock surrounding the entry changes with the strain in real time.
3.2 Explosion Driving Pressure
The peak pressure of the shock wave on the rock surrounding the borehole after the explosion of a single-borehole cylindrical explosive cartridge is [31]:

where p0 is the peak pressure of the shock wave under a single-borehole explosion;  is the expansion adiabatic coefficient (i.e., 3);
  is the density of the explosive; ve is the explosion speed of the explosive; le is the length of the explosive in the explosion borehole; l0 is the length of the explosion borehole; de is the diameter of the explosive roll; d0 is the diameter of the explosion borehole; and m is the pressure increase coefficient of the explosion shock wave (i.e., 8–11).
When multiple boreholes are blasted simultaneously, the peak stress at a certain point in the surrounding rock is [32]:

where pmax is the peak stress of the shock wave under multiple borehole explosions;  is the attenuation constant of pmax with distance (i.e.,
  , and
, and  is Poisson’s ratio); and
  are the distances from the point to the 1 − n borehole.
If the action time of the blast stress shock wave is taken into account, the shock wave pressure at the calculated point at different explosion action times can be expressed by the following equation [33]:

where pt is the shock wave pressure at various explosion times;  is the damping coefficient; t is the explosion time; and tm is the time required for the explosion pressure to reach the peak.
The EDWF of working face 1035 was driven by explosion using coal mine allowable ammonium nitrate #2 explosives.  was 950 kg/m3, de was 35 mm, ve was 3000 m/s, le was 1.65 m, l0 was 2.0 m, d0 was 42 mm, tm was 180
  s, the distance between adjacent explosion boreholes was 400 mm, and the borehole center was 300 mm from the entry contour surface. By substituting the above parameters into Eqs. (5)–(7), the change in the explosion pressure with explosion time in cross section A–A of the entry can be obtained (Fig. 5).
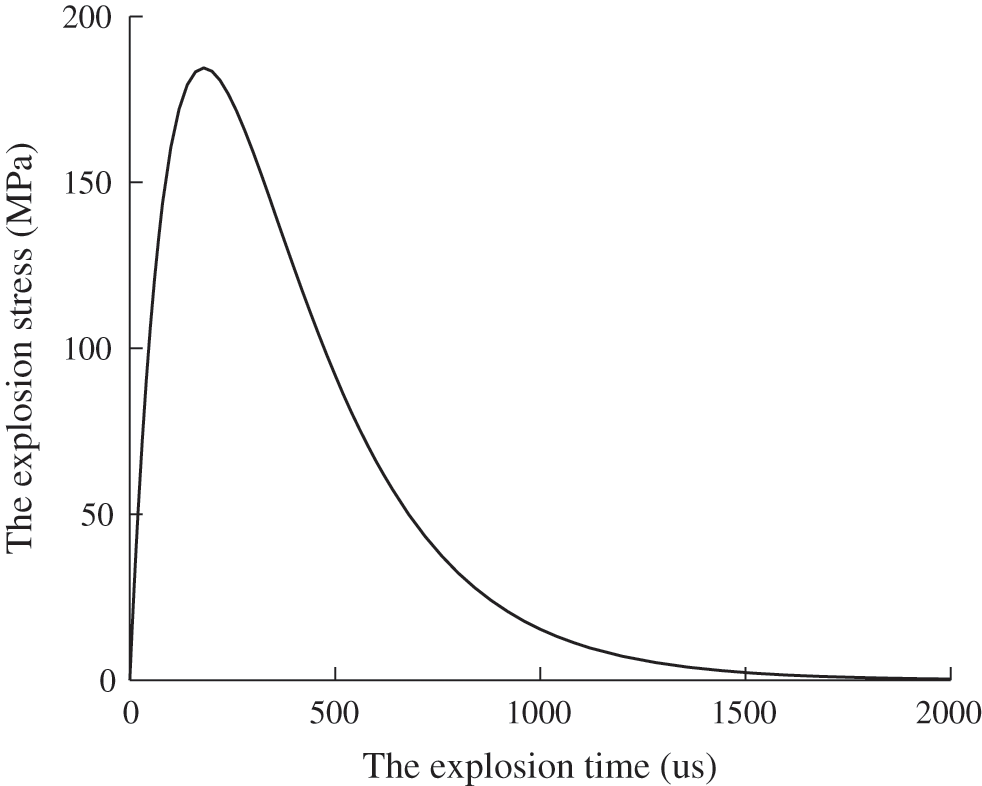
Figure 5: Change in the explosion pressure with explosion time in the cross section of the entry
4 Numerical Model and Simulation Scheme
4.1 Establishing the Numerical Model
When the “2.3” water inrush disaster occurred, the KCCIZ under the coal floor was seriously damaged, so its width was difficult to verify. In order to reproduce the process of the SKCC water inrush disaster, a key cross section (cross section A–A in Fig. 3b)) of the entry was selected for numerical simulation analysis, and the width of the KCCIZ was assumed to be B by assuming that the size of the KCCIZ around the SKCC was equal, it did not significantly affect the calculation results (Fig. 6). Considering the effect of symmetry, the numerical model was established using FLAC The model contained 239,700 nodes and 190,008 zones. The boundary conditions of the model were set as follows: 12.0 MPa and 18.0 MPa of stress were applied to the top and the right surface, respectively, and the normal displacements were fixed on the other surfaces. The seepage boundary conditions were set as follows: 4.3 MPa and 0 MPa of pore water pressure were applied to the bottom of the SKCC and the EDWF, respectively. For the anchor shotcrete support structure of the entry, a cable element was used to simulate a glass fiber bolt with Young’s elastic modulus of 30 GPa and Poisson’s ratio of 0.2. A shell element was used to simulate a high strength plastic stencil with Young’s elastic modulus of 250 GPa and Poisson’s ratio of 0.3.
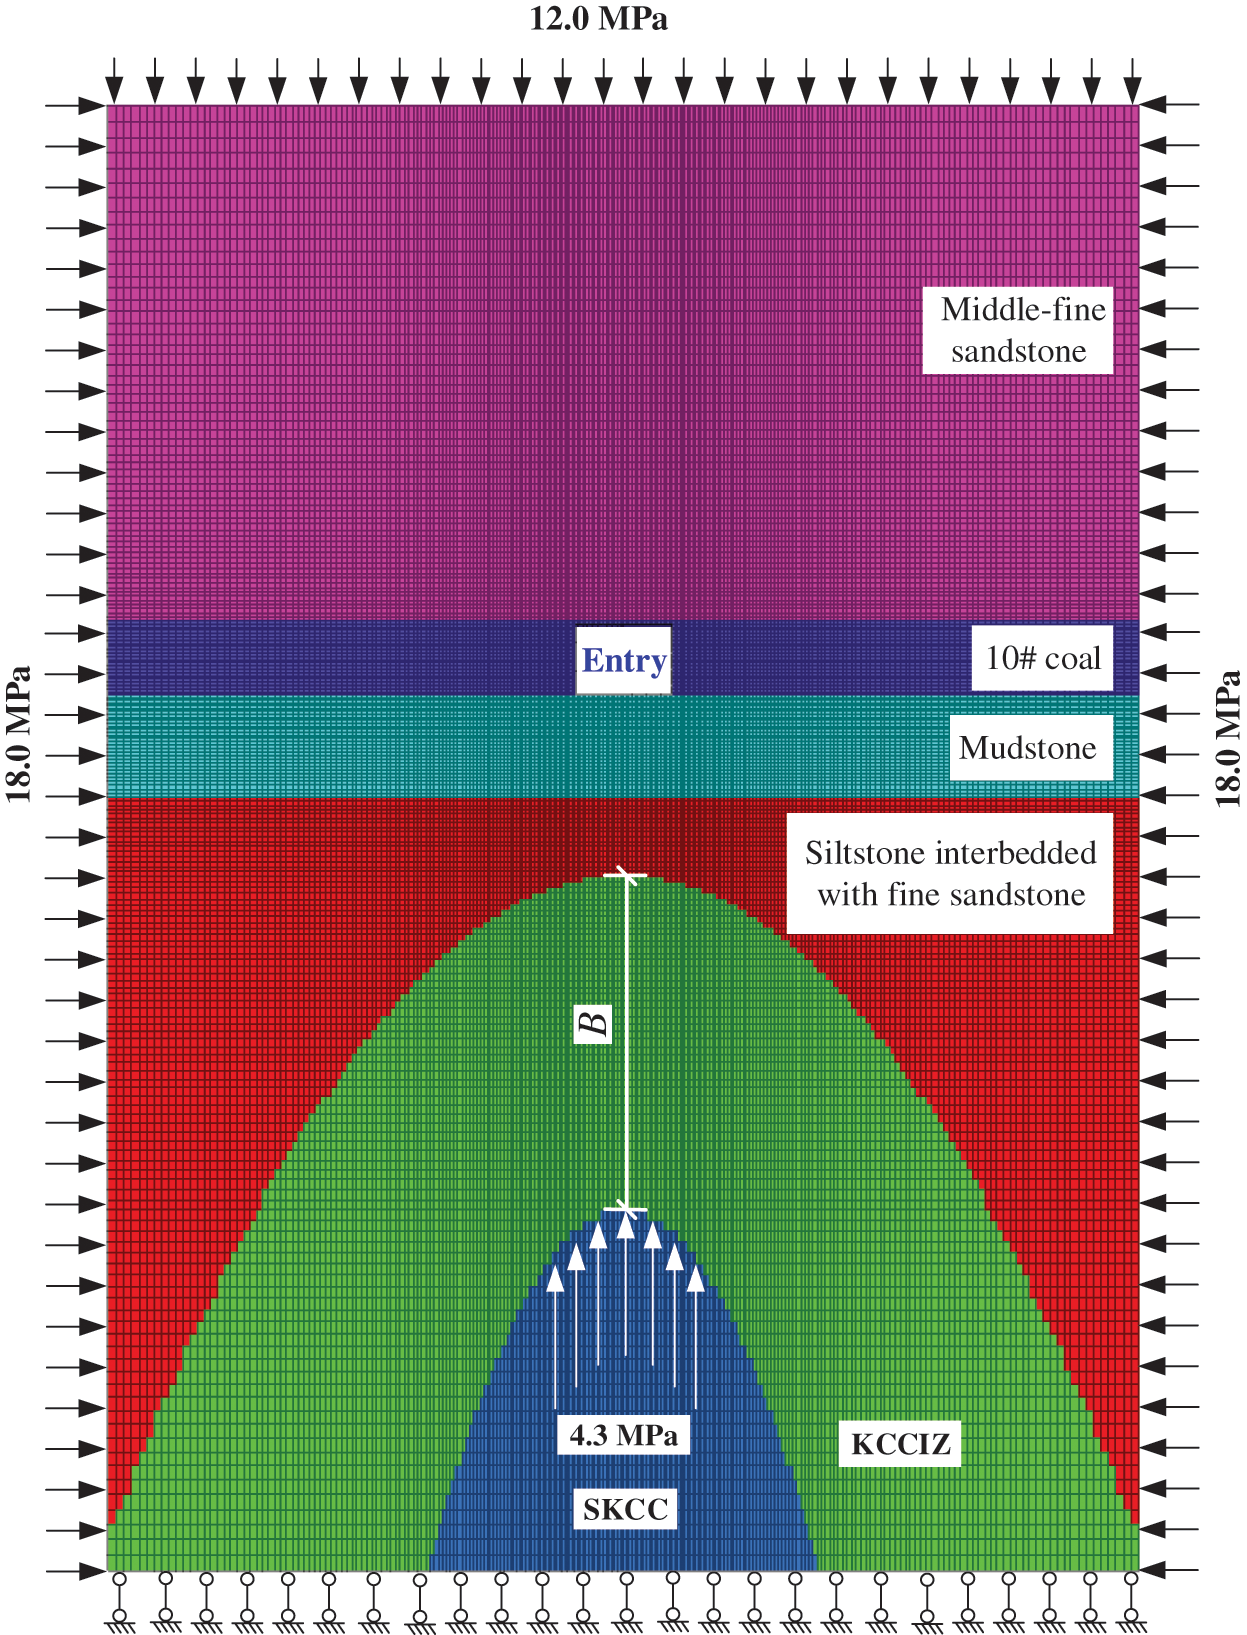
Figure 6: Numerical model of the water inrush in entry 1035
4.2 Calculation Scheme and Simulation Procedure
Fig. 7 shows the numerical simulation procedure. The numerical simulation of the SKCC water inrush in entry 1035 can be divided into four stages.
1. Initial balance
First, the water inrush model of the entry was established. Then, the seepage mode was closed (set flow to off), the mechanical parameters were applied using the parameters in Tab. 1, the stress and displacement boundary conditions were set, and the initial stress balance was carried out. Finally, we opened the seepage mode (set flow to on), applied the seepage parameters (Tab. 1), set the seepage boundary conditions, and calculated the initial seepage balance.
2. Explosion driving simulation
As the explosion driving was a short-term dynamic behavior, the seepage mode was closed and the dynamic mode was turned on before the explosion pressure was applied. The pressure-time relationship shown in Fig. 5 was used to apply the surface force to the numerical model, and the explosion driving numerical calculation was performed. After the completion of the explosion driving simulation, the dynamic mode was closed, the seepage mode was turned on, and the seepage field was calculated again until a balance was reached. The coupling equations between stress and flow fields are as follows:
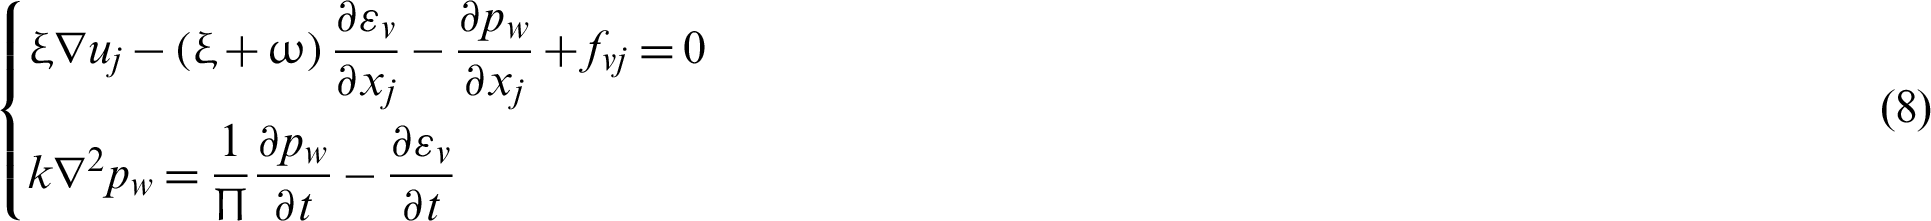
where  and
and  are Lame constants; pw is pore pressure;
  is the volumetric strain; xj, uj, fvj are the zone coordinates, displacement and volume force in the j direction, respectively;
  is the fluid Biot Modulus.
3. Add support and write fish language
After the explosion driving simulation, the rock mass surrounding the entry was supported using the methods shown in Fig. 2. Then, the built-in program of the fluid–solid coupling fish language composed of Eqs. (2)–(4) was written in FLAC .
.
4. Water inrush simulation
In order to analyze the effect of the width of the KCCIZ on the SKCC water inrush in Taoyuan coal mine, we conducted a total of six sets of different numerical simulation calculations using KCCIZ widths of 0, 5, 10, 15, 16, and 18 m.
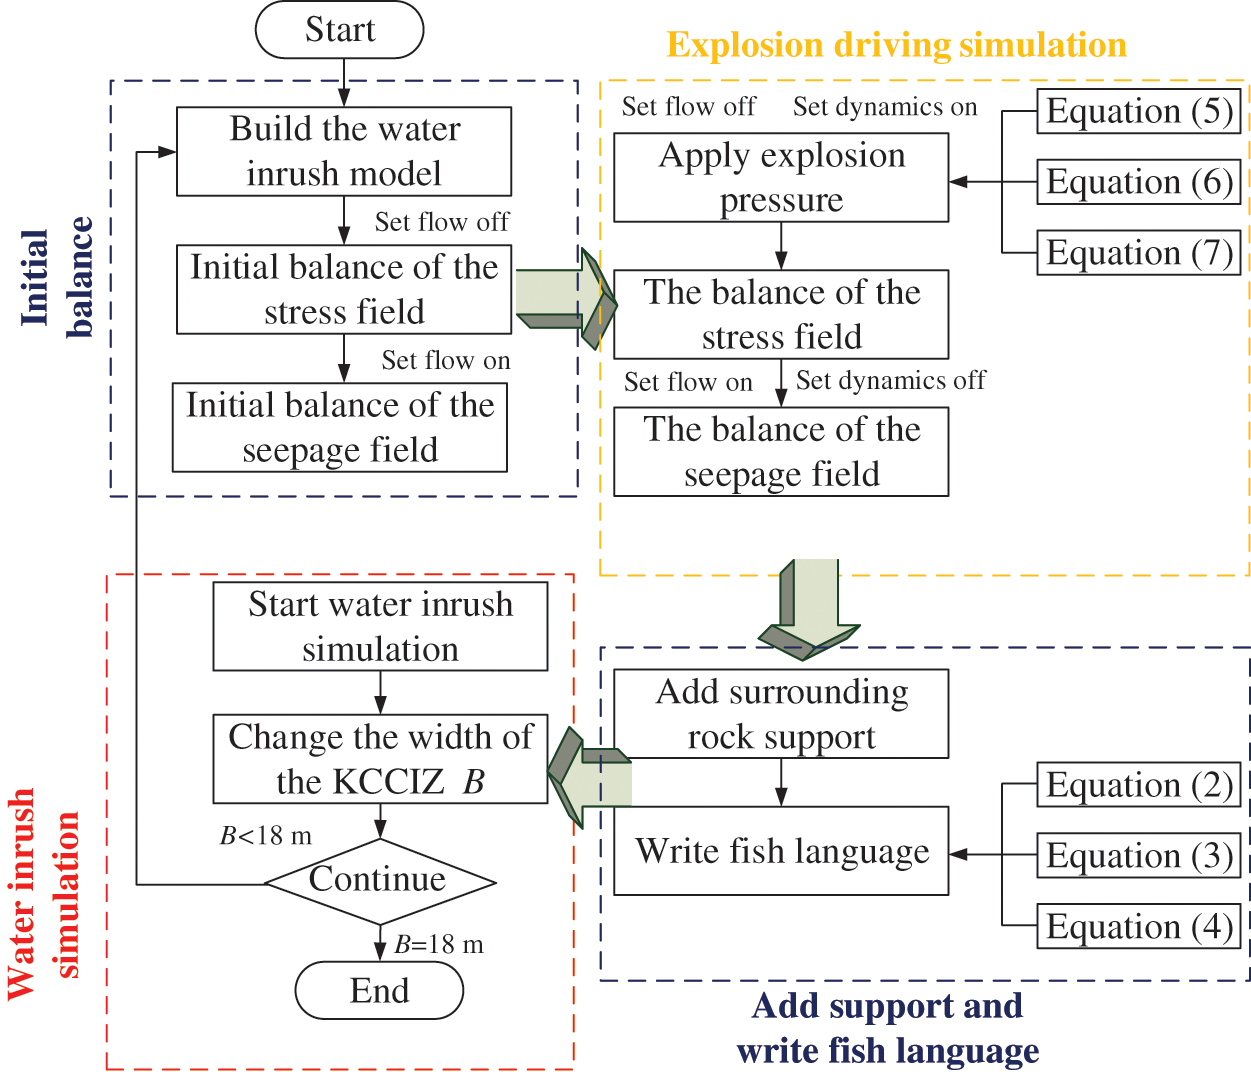
Figure 7: The FLAC numerical simulation procedure
5 Numerical Calculation Results
Fig. 8 shows the change in the plastic zones as the width of the KCCIZ (B) changes. In the FLAC numerical simulation, the plastic zone represents the failure of the rock mass, which not only causes a decrease in the capacity of the rock mass but also causes an increase in the permeability coefficient of that rock. Generally, the connection between the plastic zone and the confined aquifer can be used as the discrimination standard for the occurrence of water inrush [19]. The range of the plastic zone increased with increasing B. When B was 0 m and 8 m, there was an approximate distance between the plastic zone and the SKCC. When B was 15 m, the plastic zones were close to the SKCC. When B was 16 m and 18 m, the plastic zones were connected to the SKCC, indicating that a water inrush disaster had occurred. Therefore, B of the entry face 1035 water inrush disaster should be larger than 15 m.
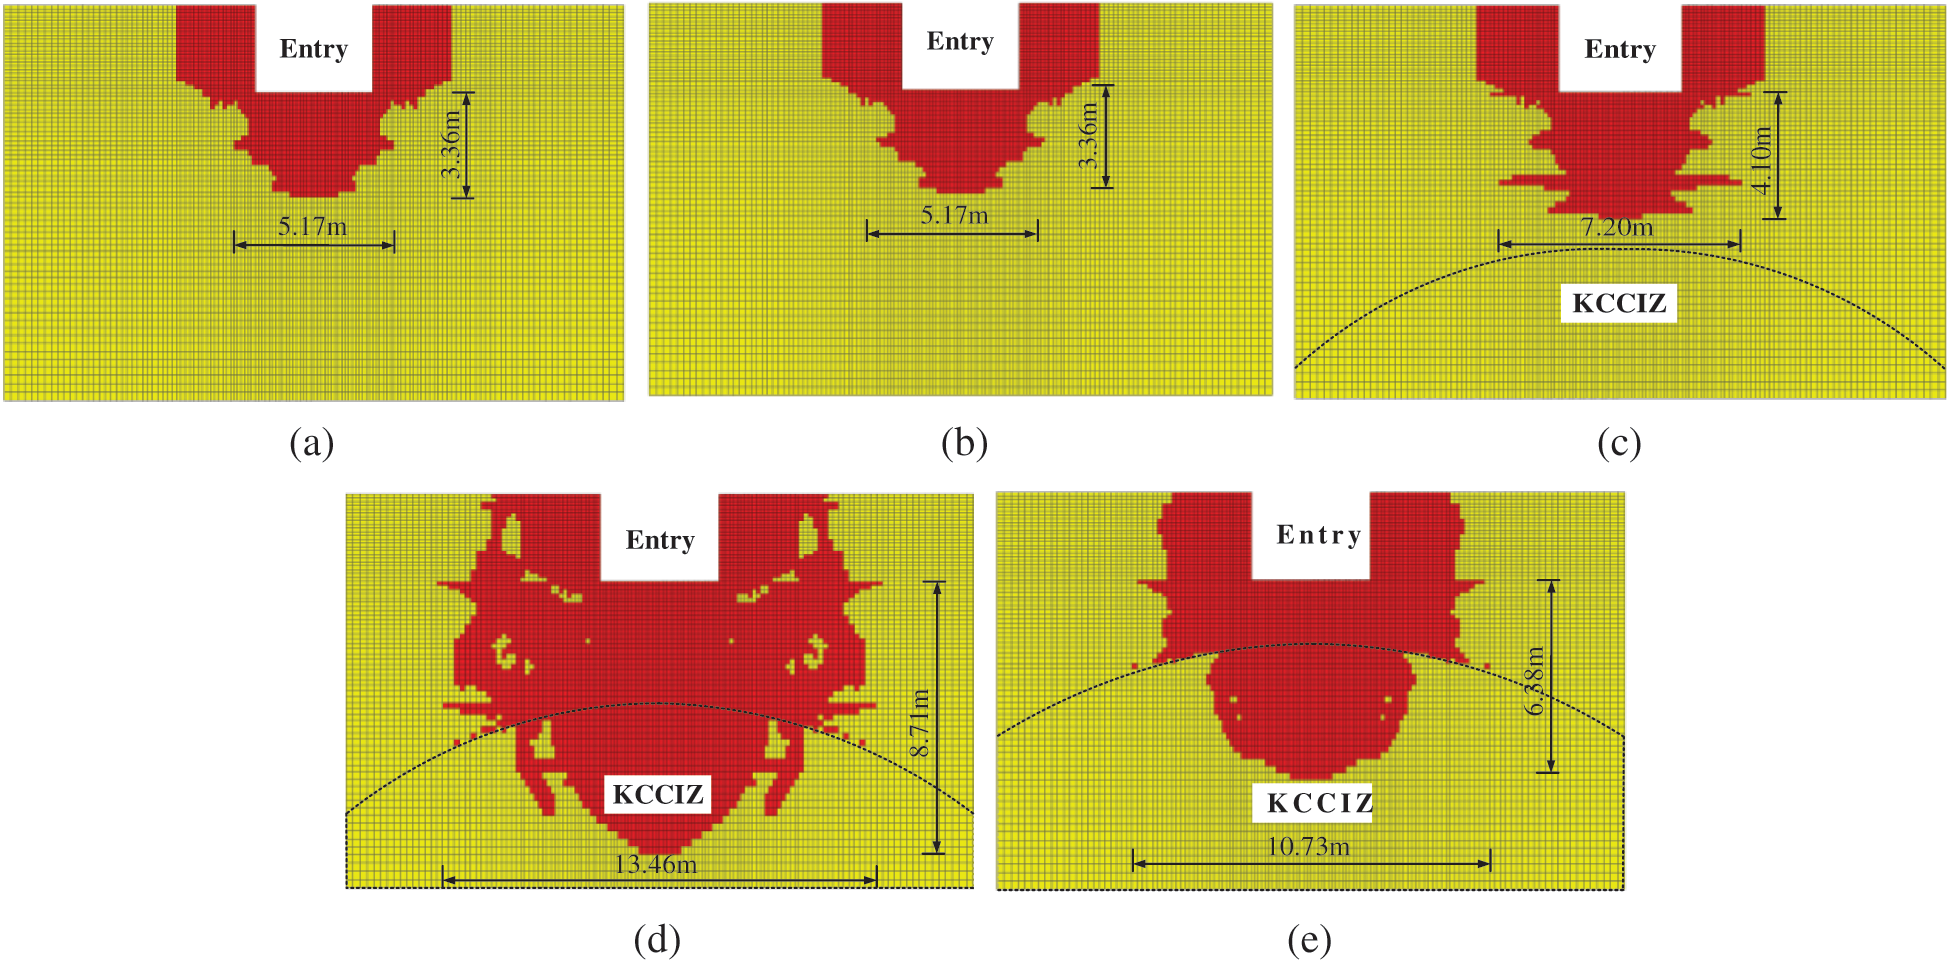
Figure 8: Change in the plastic zones of the surrounding rock mass as the width of the KCCIZ (B) changes. (a) B = 0 m. (b) B = 8 m. (c) B = 15 m. (d) B = 16 m. (e) B = 18 m
Fig. 9 shows the change in the vertical displacement as the width of the KCCIZ (B) changes. When B was 0 and 8 m, the vertical displacement of the rock surrounding the entry floor was 53.3 mm, which is within the range of normal floor heave [34–36]. When B was 15 m, the vertical displacement of the rock surrounding the entry floor increased to about 130 mm, which is greater than the normal range of floor heave. When B was 16 m and 18 m, the vertical displacement of the rock surrounding the entry floor increased to more than 270 mm, the surrounding rock showed an overall upward displacement, and it can be determined that the surrounding rock was fractured throughout.
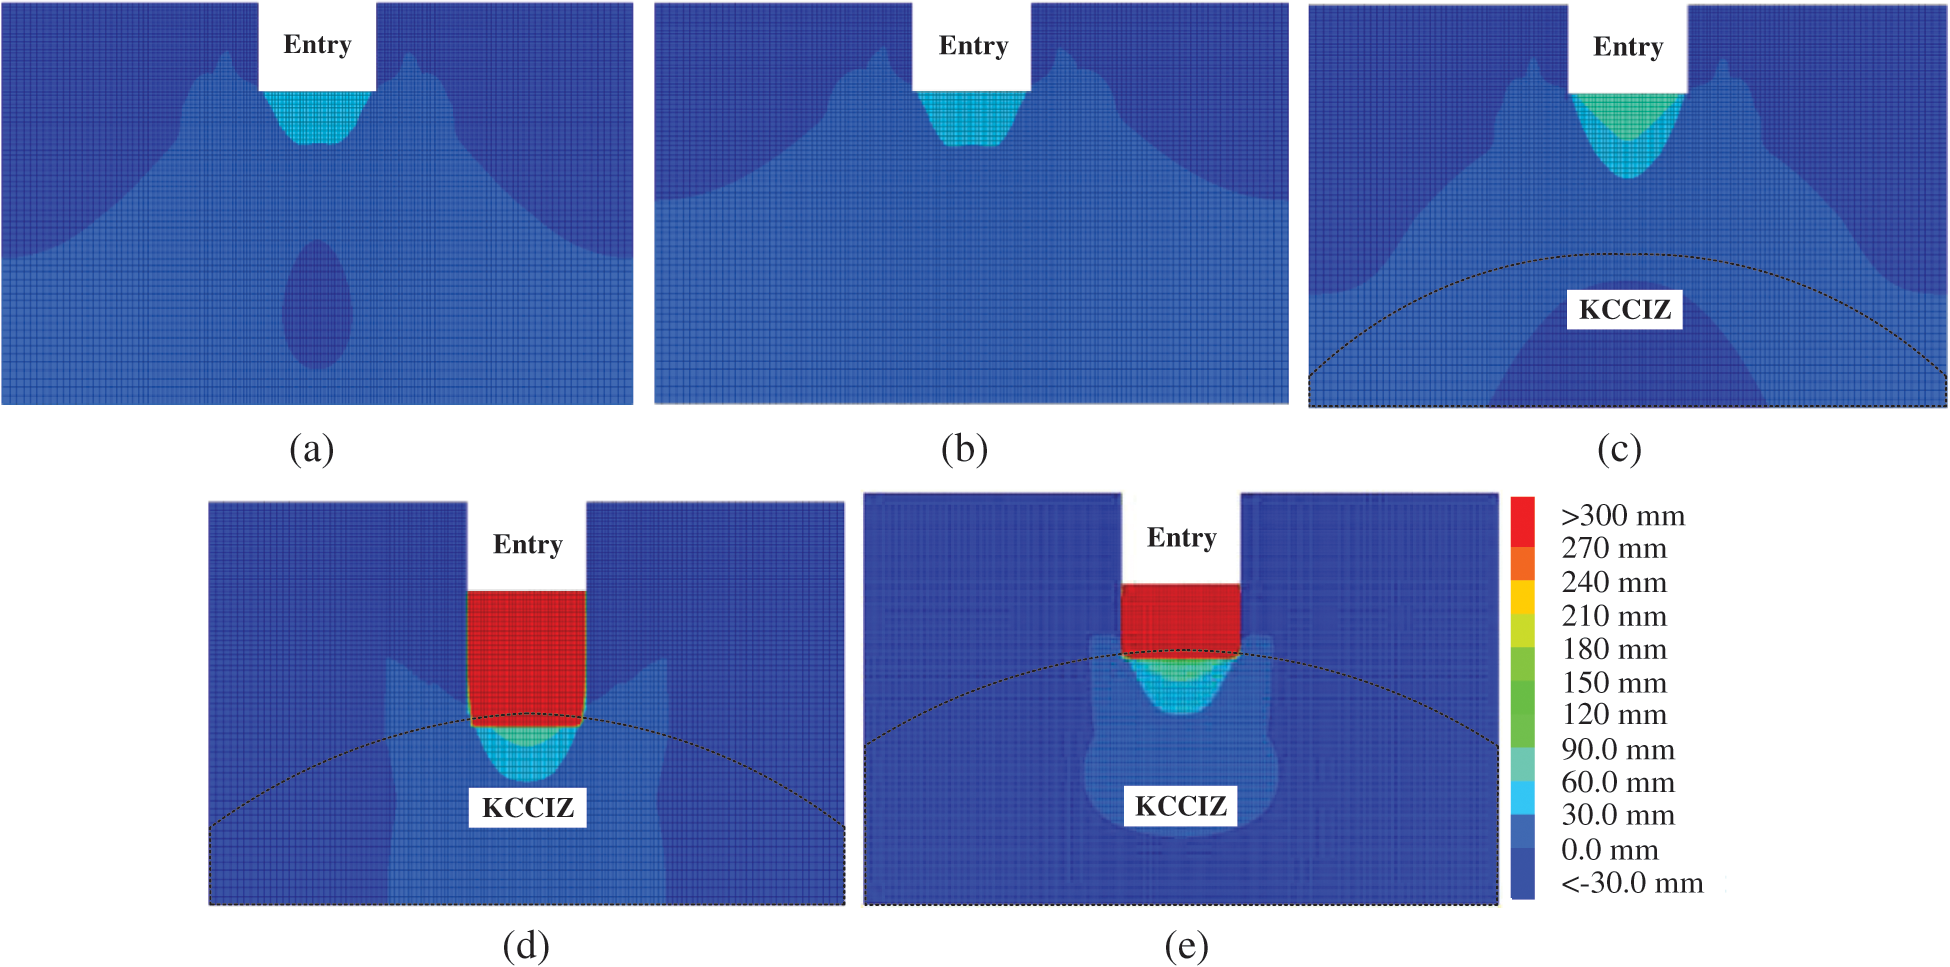
Figure 9: Change in the vertical displacement of the surrounding rock mass as the width of the KCCIZ (B) changes. (a) B = 0 m. (b) B = 8 m. (c) B = 15 m. (d) B = 16 m. (e) B = 18 m
Fig. 10 shows the change in the seepage vector of the surrounding rock mass as the width of the KCCIZ (B) changes, and Fig. 11 shows the change in the water inflow of the entry as the width of the KCCIZ changes. When B was 0 and 8 m, there was no seepage in the entry floor. When B was 15 m, the seepage vector appeared in the entry floor, and the water inflow reached about 3,000 m3/h. In this case, a water inrush disaster was inevitable. When B was 16 m and 18 m, the seepage vector in the EDWF floor was connected with the KCCIZ, and the water inflow reached more than 20,000 m3/h, indicating that a water inrush disaster had occurred. Among them, when B was 16 m, the water inflow from the EDWF floor was about 22,426 m3/h, which was close to the water inrush disaster in which the water inflow reached 29,000 m3/h.
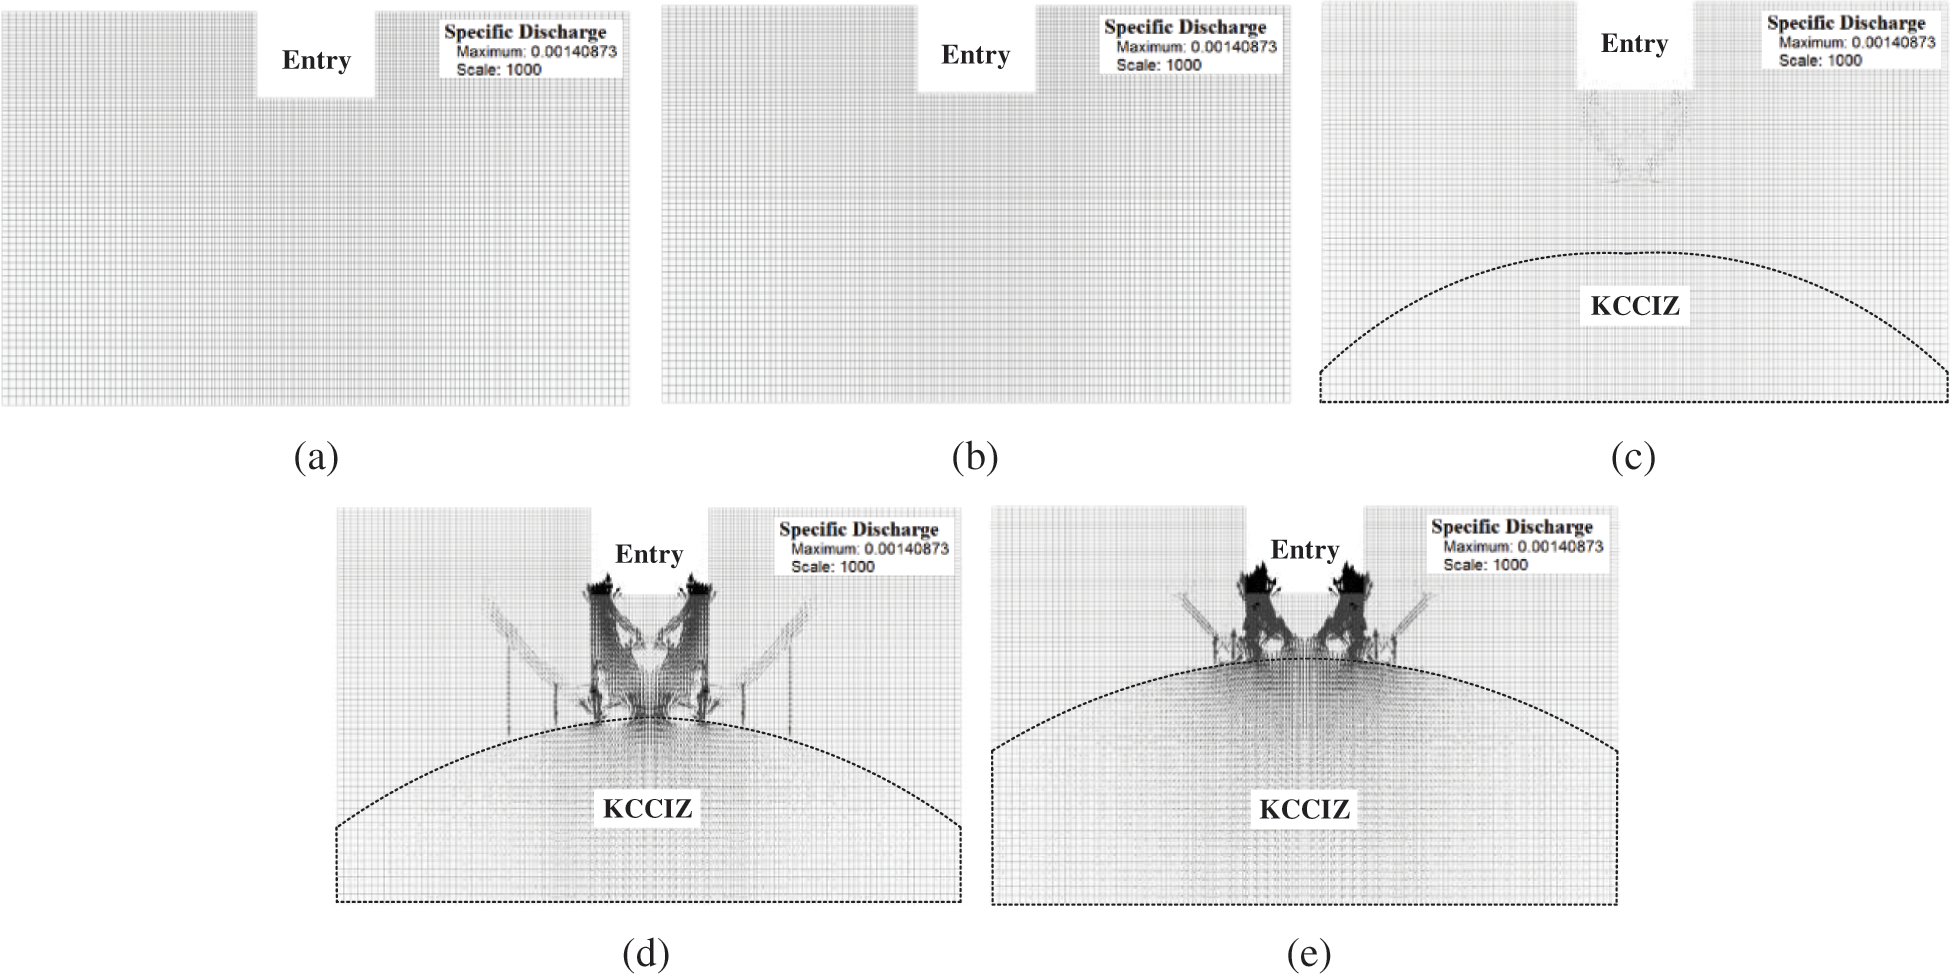
Figure 10: Change in the seepage vector of the surrounding rock mass as the width of the KCCIZ (B) changes. (a) B = 0 m. (b) B = 8 m. (c) B = 15 m. (d) B = 16 m. (e) B = 18 m
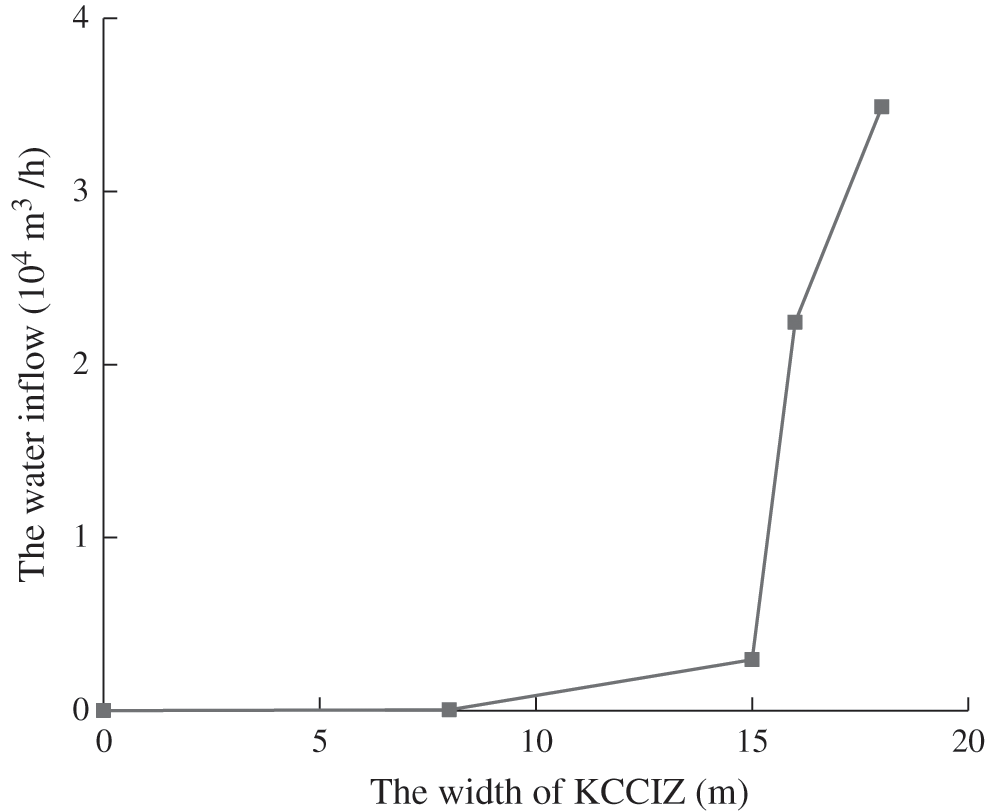
Figure 11: Change in the water inflow of the entry as the width of the KCCIZ changes
6.1 Hysteretic Water Inrush Mechanism
The SKCC water inrush in Taoyuan mine occurred after the EDWF passed the water inrush point of 12 m, which indicates that the SKCC water inrush was a hysteretic disaster. Hysteresis was an important characteristic of the SKCC or KCC water inrush, which occurred in the Fangezhuang SKCC water inrush, the Zhangji SKCC water inrush, and the Luotuoshan SKCC water inrush [10,18]. Previous studies on the hysteretic SKCC water inrush mechanism have suggested that the particles in the SKCC are constantly migrating and lost during the seepage process, resulting in a change in the seepage regime [37–40]. However, the asynchronous release of the mining stress may also be one of the causes of the hysteretic water inrush in SKCC. Therefore, we further studied the different stress release rates to analyze the hysteretic SKCC water inrush mechanism in Taoyuan coal mine.
The stress release rate f is expressed as follows [31,41,42]:

where s0 is the initial stress on the rock mass; sa is the surface force applied to the rock mass surrounding the entry; and ss is the support stress, which is approximately 0 since the support effect of the EDWF floor is weak (Fig. 1). f0 is the stress release rate of the rock mass surrounding the entry, which is 0.4 for elastic–plastic surrounding rock [43]; x is the distance between the EDWF and cross section A–A; and RA is the influence radius of the EDWF, which is approximately equal to the excavation radius for this project (2.36 m). Fig. 12 shows the change in the stress release rate with driving distance from the water inrush point. The stress release rate f increased with increasing driving distance from the water inrush point x. When x was 0, 2, 4, 8, and 10 m, f was 0.40, 0.74, 0.89, 0.98, and 0.99, which indicates that the stress was fully released when x was greater than 10 m.
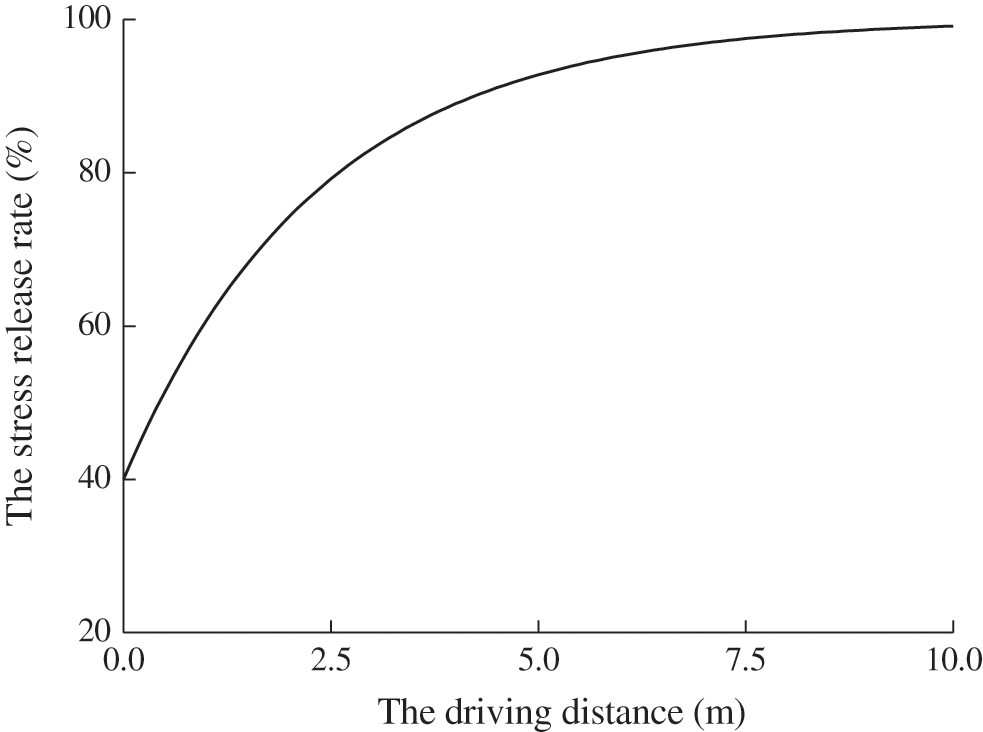
Figure 12: Change in the stress release rate with driving distance from the water inrush point
Fig. 13 shows the plastic zone distribution of the rock mass around the entry for different rock stress release rates (the width of the KCCIZ in Fig. 13 is 16 m). According to Eq. (9), when f was 40% (i.e., x was 0 m), due to the explosive stress wave effect, the rock mass surrounding the EDWF generated a large plastic yielding phenomenon. At this point, the floor of the entry appeared to be on the rectangular plastic zone, its width was about the same as that of the EDWF, which was about 4.01 m, and its height was 2.33 m (Fig. 13a). When f was increased to 80%, 90%, and 95% (x was 2.5, 4.3, and 5.9 m, respectively), due to the effect of the bolt-mesh support, the plastic zone of the rock surrounding the entry expanded slightly, and the plastic zone of the EDWF floor extended downward by about 0.34 m and 0.64 m (Figs. 13b–13d). When f was further increased to close to 100% (x was 10.0 m), the plastic zone of the entry floor was connected with the KCCIZ, and a water inrush disaster occurred. After this, the plastic zone continued to expand to the two sides of the entry. The maximum widths of the plastic zone of the floor and the two sides were 13.5 m and 8.7 m, respectively (Fig. 13e). Therefore, the stress release rate was an important factor influencing the hysteretic water inrush from the SKCC. Only when the EDWF exceeded the water inrush point by 10 m (i.e., the stress was fully released) did a water inrush disaster occur. This is consistent with the actual phenomenon of the SKCC water inrush with a hysteresis of about 12 m in Taoyuan coal mine.
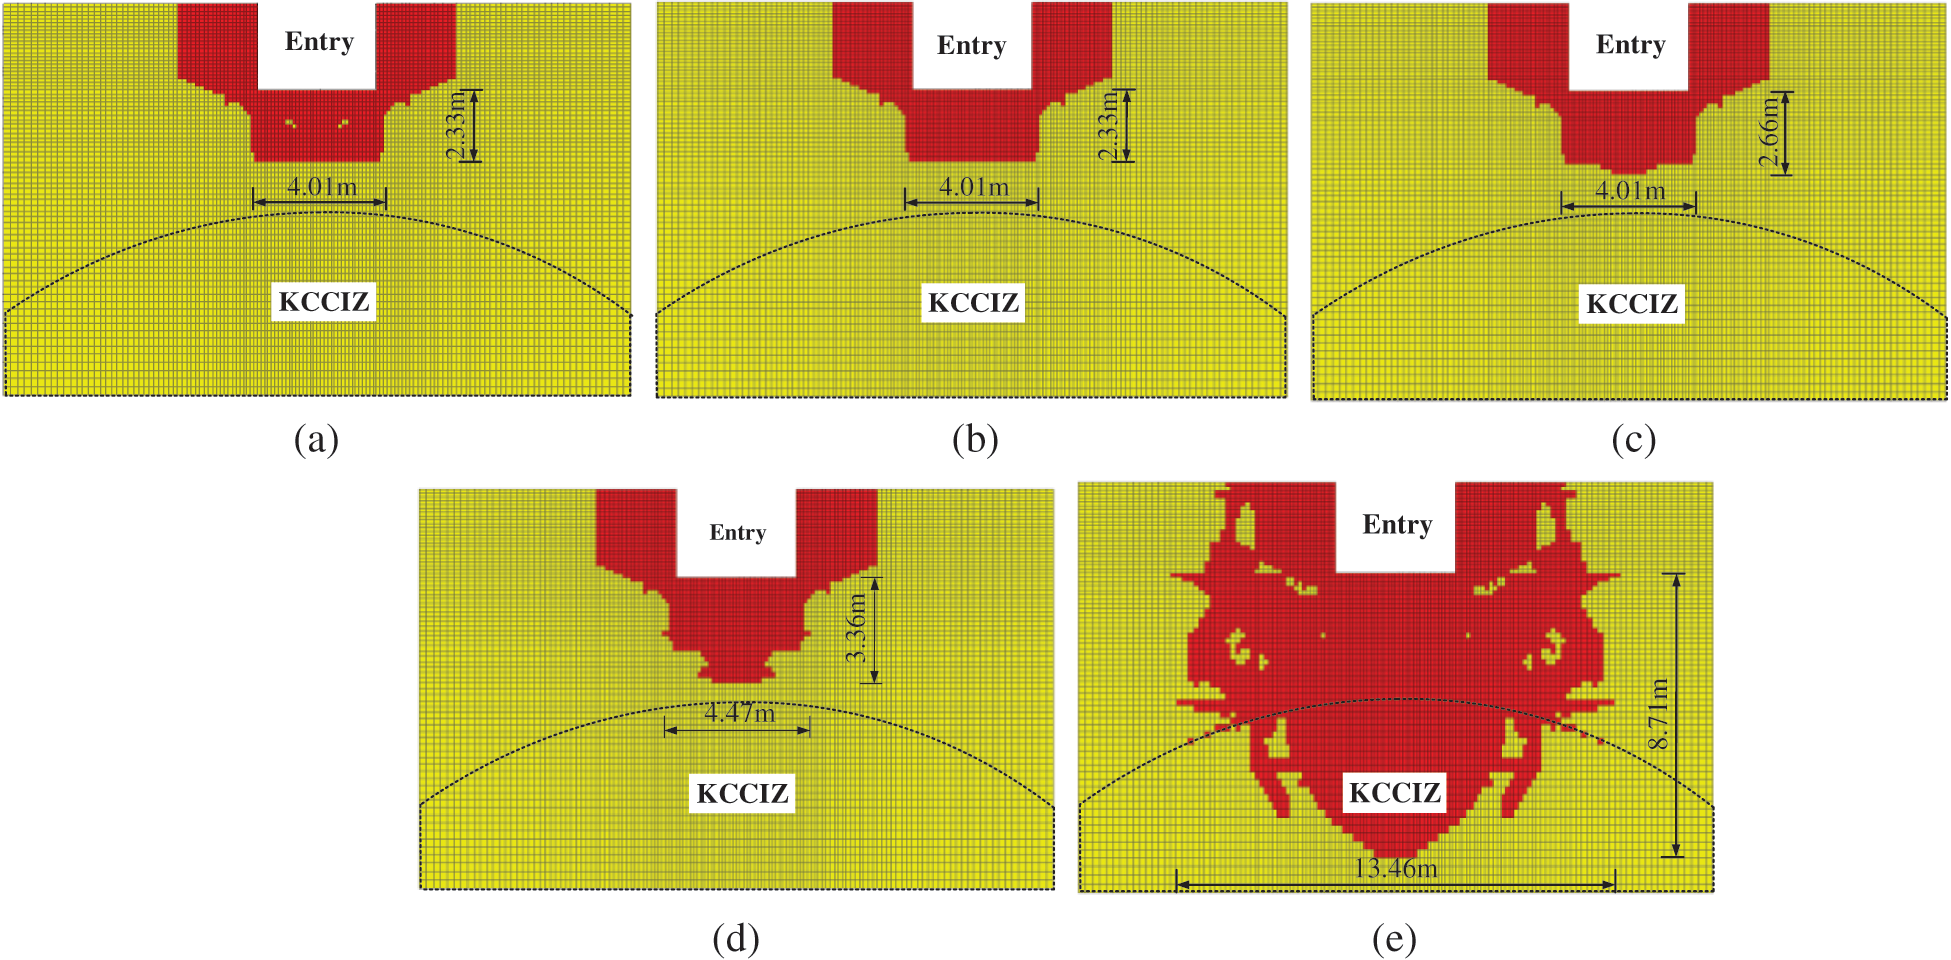
Figure 13: The plastic zone distribution of the rock mass surrounding the entry for different rock stress release rates. (a)  (after blasting). (b)
  . (c)
. (c)  . (d)
. (d) 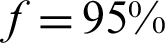 . (e)
. (e) 
Fig. 14 shows the permeability coefficient distribution of the rock mass surrounding the WDWF for different rock stress release rates (when the width of the KCCIZ is 16 m).
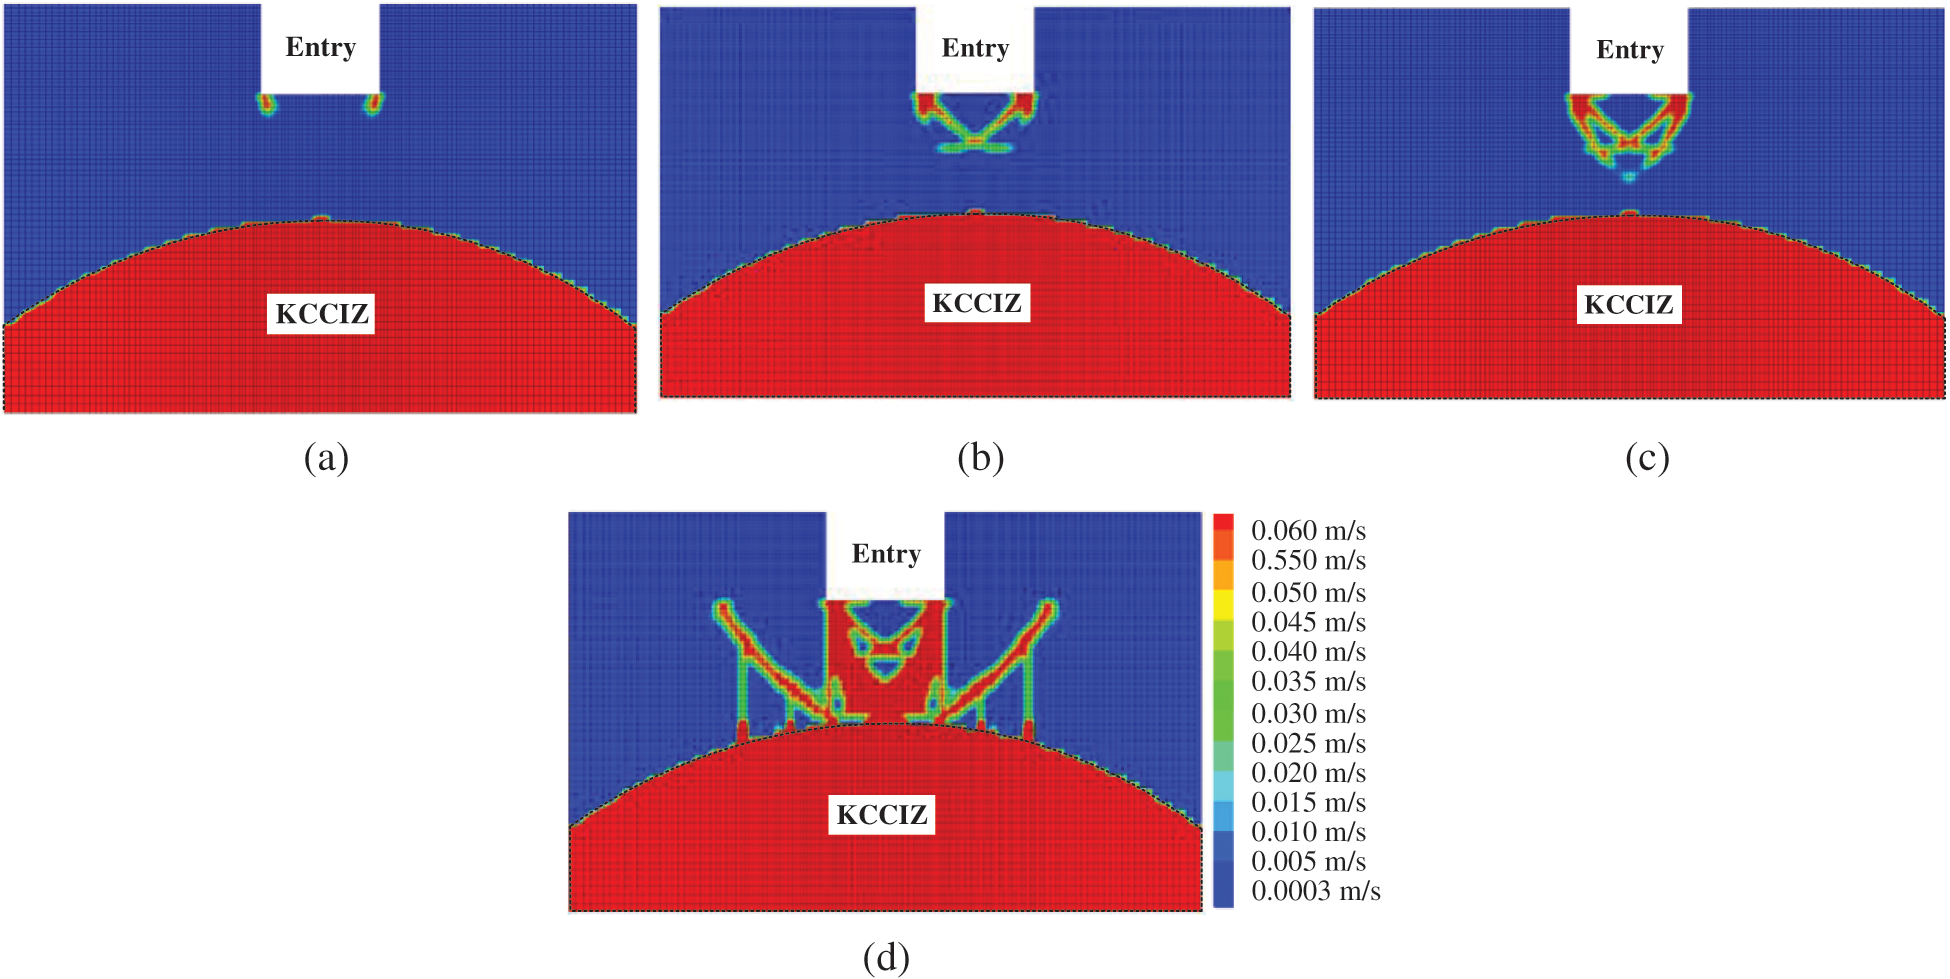
Figure 14: The permeability coefficient distribution of the rock mass surrounding the WDWF for different rock stress release rates. (a)  . (b)
. (b)  . (c)
. (c)  . (d)
. (d) 
It can be seen from the figure that (1) when f was less than or equal to 80% (i.e., 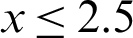 m), the entry floor’s rock mass had plastically yielded in the explosion excavation, because the plastic strain values were smaller, and damage was relatively limited. Therefore, the permeability coefficient of the plastic zones was not large in the rock mass of the entry floor, and seepage mutation only appeared at the corners. (2) When f was 90%, there were two symmetric shear strain concentration zones 1.7 m away from the KCCIZ in the corners of both sides of the entry floor, which intersected at the lower part of the entry floor, and their internal permeability coefficient rapidly increased from 0.0003 m/s to 0.06 m/s. (3) When f was 95% (i.e., x was 5.9 m), there were another two shear strain concentration zones extending 2.7 m below the center of the entry floor in each side corner, and they intersected with the end of the previous shear strain zone. In the plastic zone, multiple interconnected dominant water channels began to appear in the rock mass. (4) When f was 100% (i.e., x was 10.0 m), the water-resisting layer between the entry floor and the KCCIZ and the limited water-resisting layer were breached by the high pressure water, and the confined water entered the entry through the shear strain concentration zone of the entry floor. Moreover, the water channel was broadened continuously by the fluid–solid coupling. The average permeability coefficient of the rock mass in the plastic zone of the entry floor increased significantly, and the prime location of the water inrush from the SKCC was the corner point of the entry floor.
In this paper, the water inrush disaster from SKCC in Taoyuan mine was studied, and the hysteretic mechanism of the water inrush was discussed using the method of coupling the stress, displacement, and impact dynamics. The following conclusions were drawn from the results of this study.
1. A multi-field coupling calculation method was established to simulate water inrush from the SKCC under entry driving, and the water inrush process in Taoyuan coal mine was simulated.
2. The influence of the width of the SCCIZ on the water inrush disaster was analyzed, and it was determined that a water inrush disaster will occur only when the width exceeds 16 m.
3. The water inrush from SKCC in Taoyuan coal mine had hysteresis, which was related to the stress release rate of the surrounding rock mass under entry driving. When the entry driving distance from the water inrush point exceeded about 10 m, the stress release rate reached about 100%, and a water inrush disaster occurred.
Funding Statement: The work was supported by the National Natural Science Foundation of China (Project Nos. 51708185, 41807209 and 51778215, SC, http://www.nsfc.gov.cn), the Young Teacher Foundation of HPU (Project No. 2019XQG-19, SC, http://www6.hpu.edu.cn/rsc), the Henan Provincial Youth Talent Promotion Program (Project No. 2020HYTP003, SC, http://www.hast.net.cn:82), and the Doctor Foundation of Henan Polytechnic University (Project No. B2017-51 and B2017-53, SC, http://kxc.hpu.edu.cn). The authors want to acknowledge these financial assistances. In addition, we thank LetPub (www.letpub.com) for its linguistic assistance during the preparation of this manuscript.
Conflicts of Interest: The authors declare that they have no conflicts of interest to report regarding the present study.
1. Vutukuri, V. S., Singh, R. N. (1995). Mine inundation-case histories. Mine Water and the Environment, 14(1), 107–130. DOI 10.1007/BF02914857. [Google Scholar] [CrossRef]
2. Li, G. Y., Zhou, W. F. (2006). Impact of karst water on coal mining in North China. Environmental Geology, 49(3), 449–457. DOI 10.1007/s00254-005-0102-3. [Google Scholar] [CrossRef]
3. Wang, D. P. (2016). Research on mechanism of mining-induced hidden karst subsidence column water inrush and seepage coupling model. Coal Engineering, 48, 93–96 (in Chinese). [Google Scholar]
4. Sun, J., Wang, L., Zhao, G. (2018). Failure characteristics and confined permeability of an inclined coal seam floor in fluid–solid coupling. Advances in Civil Engineering, 2018, 1–12. [Google Scholar]
5. Ma, D., Miao, X. X., Jiang, G. H., Chen, Z. Q. (2014). An experimental investigation of permeability measurement of water flow in crushed rocks. Transport in Porous Media, 105(3), 571–595. DOI 10.1007/s11242-014-0385-5. [Google Scholar] [CrossRef]
6. Wang, L. Z., Kong, H. L. (2018). Variation characteristics of mass-loss rate in dynamic seepage system of the broken rocks. Geofluids, 2018(11), 1–17. DOI 10.1155/2018/7137601.
7. Ma, D., Wang, J. J., Li, Z. H. (2019). Effect of particle erosion on mining-induced water inrush hazard of karst collapse pillar. Environmental Science and Pollution Research, 26(19), 19719–19728. DOI 10.1007/s11356-019-05311-x.
8. Wu, J. Y., Han, G. S., Feng, M. M., Kong, H. L., Yu, B. Y. et al. (2019). Mass-loss effects on the flow behavior in broken argillaceous red sandstone with different particle-size distributions. Comptes Rendus Mécanique, 347(6), 504–523. DOI 10.1016/j.crme.2019.03.014. [Google Scholar] [CrossRef]
9. Boldini, D., Graziani, A. (2012). Remarks on axisymmetric modelling of deep tunnels in argillaceous formations-II: Fissured argillites. Tunnelling and Underground Space Technology, 28, 80–89. DOI 10.1016/j.tust.2011.10.007. [Google Scholar] [CrossRef]
10. Yang, T. H., Jia, P., Shi, W. H., Liu, H. L., Yu, Q. L. (2014). Seepage-stress coupled analysis on anisotropic characteristics of the fractured rock mass around roadway. Tunnelling and Underground Space Technology, 43, 11–19. DOI 10.1016/j.tust.2014.03.005. [Google Scholar] [CrossRef]
11. Yue, Z. Q., Xu, Q. (2014). Fundamental drawbacks and disastrous consequences of current geotechnical safety design theories for slopes. Chinese Journal of Geotechnical Engineering, 36, 1601–1606 (in Chinese). [Google Scholar]
12. Zhang, B. Y., Bai, H. B., Zhang, K. (2016). Experimental research on seepage mutation mechanism of collapse column medium. Rock and Soil Mechanics, 37(5), 745–752. DOI 10.1016/S1365-1609(00)00008-3 (in Chinese). [Google Scholar] [CrossRef]
13. Yin, S. X., Han, Y., Zhang, Y. S., Zhang, J. C. (2016). Depletion control and analysis for groundwater protection and sustainability in the Xingtai region of China. Environmental Earth Sciences, 75(1), 13. DOI 10.1007/s12665-015-4849-x. [Google Scholar] [CrossRef]
14. Yin, Q., Liu, R. C., Jing, H. W., Su, H. J., Yu, L. Y. (2019). Experimental study of nonlinear flow behaviors through fractured rock samples after high temperature exposure. Rock Mechanics and Rock Engineering, 52(9), 2963–2983. DOI 10.1007/s00603-019-1741-0. [Google Scholar] [CrossRef]
15. Yao, B. H., Wei, J. P., Wang, D. K., Ma, D., Chen, Z. Q. (2013). Numerical study of seepage property of karst collapse columns under particle migration. Computer Modeling in Engineering & Sciences, 91, 81–100. [Google Scholar]
16. Yao, B. H., Chen, Z. W., Wei, J. P., Bai, T. H., Liu, S. M. (2018). Predicting erosion-induced water inrush of karst collapse pillars using inverse velocity theory. Geofluids, 2018(2), 1–18. DOI 10.1155/2018/2090584. [Google Scholar] [CrossRef]
17. Bai, H. B., Ma, D., Chen, Z. Q. (2013). Mechanical behavior of groundwater seepage in karst collapse pillars. Engineering Geology, 164, 101–106. DOI 10.1016/j.enggeo.2013.07.003. [Google Scholar] [CrossRef]
18. Ma, D., Miao, X. X., Chen, Z. Q., Mao, X. B. (2013). Experimental investigation of seepage properties of fractured rocks under different confining pressures. Rock Mechanics and Rock Engineering, 46(5), 1135–1144. DOI 10.1007/s00603-012-0329-8. [Google Scholar] [CrossRef]
19. Ma, D., Miao, X. X., Bai, H. B., Huang, J. H., Pu, H. et al. (2016). Effect of mining on shear sidewall groundwater inrush hazard caused by seepage instability of the penetrated karst collapse pillar. Natural Hazards, 82(1), 73–93. DOI 10.1007/s11069-016-2180-9. [Google Scholar] [CrossRef]
20. Yin, S. X., Wu, Q. (2004). Simulation and mechanism analysis of water inrush from karstic collapse columns in coal floor. Chinese Journal of Rock Mechanics and Engineering, 23, 2551–2556 (in Chinese). [Google Scholar]
21. Xia, K. Z., Chen, C. X., Zheng, Y., Zhang, H. N., Liu, X. Mi. et al. (2019). Engineering geology and ground collapse mechanism in the Chengchao Iron-ore Mine in China. Engineering Geology, 249, 129–147. DOI 10.1016/j.enggeo.2018.12.028.
22. Dong, S. N. (2010). Some key scientific problems on water hazards frequently happened in China’s coal mines. Journal of the China Coal Society, 35, 66–71. [Google Scholar]
23. Li, G. C., Zhang, N., Wang, C., Zhang, N. C., Li, B. Y. (2010). Optimizing the section shape of roadways in high stress ground by numerical simulation. Journal of China University of Mining & Technology, 39, 652–658 (in Chinese). [Google Scholar]
24. Wang, Z. W., Fang, J. Q., Xia, C. C., Bian, Y. W., He, K. (2011). A method for determining second lining supporting opportunity in soft rock tunnel. Advanced Materials Research, 243–249, 3644–3651. DOI 10.4028/www.scientific.net/AMR.243-249.3644. [Google Scholar] [CrossRef]
25. Sun, J. S., Liu, W. B. (2007). Analytical elastoplastic solutions to supporting rock masses of circular tunnels under asymmetric load. Rock and Soil Mechanics, 37, 327–332 (in Chinese). [Google Scholar]
26. Peng, J., Rong, G., Cai, M., Peng, K. (2015). Determination of residual strength of rocks by a brittle index. Rock and Soil Mechanics, 36, 403–408. [Google Scholar]
27. Jing, W., Xue, W. P., Yao, Z. S. (2018). Variation of the internal friction angle and cohesion of the plastic softening zone rock in roadway surrounding rock. Journal of China Coal Society, 43, 2203–2210 (in Chinese). [Google Scholar]
28. Chen, S. K., Yang, T. H., Liu, H. L., Zhu, W. H. (2011). Water inrush monitoring of Zhangmatun mine grout curtain and seepage-stress-damage research. Materials Science Forum, 704–705, 558–562. DOI 10.4028/www.scientific.net/MSF.704-705.558. [Google Scholar] [CrossRef]
29. Brace, W. F., Walsh, J. B., Frangos, W. T. (1968). Permeability of granite under high pressure. Journal of Geophysical Research, 73(6), 2225–2236. DOI 10.1029/JB073i006p02225. [Google Scholar] [CrossRef]
30. Itasca, F. D. (2009). Fast lagrangian analysis of continua in 3 dimensions, version 4.0. pp. 438. Minneapolis, Minnesota: Itasca Consulting Group. [Google Scholar]
31. Dai, J., Liu, Y. (2011). The method of optimizing blasting parameters for driving tunnel based on the outcome analyses. Advanced Materials Research, 243–249, 3449–3455. DOI 10.4028/www.scientific.net/AMR.243-249.3449. [Google Scholar] [CrossRef]
32. Lei, G., Li, Y. H., Xu, S. D., Lu, Y. (2017). Simulation study on blasting damage law of deep rock mass based on FLAC3D. Metal Mine, 10, 135–140 (in Chinese). [Google Scholar]
33. Jong, Y., Lee, C., Jeon, S. (2005). Numerical modeling of the circular-cut using particle flaw code. 31st Annular Conference of Explosives and Blasting Technique, Vol. 2005. Orlando, USA. [Google Scholar]
34. Yin, Q., Ma, G. W., Jing, H. W., Wang, H. D., Su, H. J. (2017). Hydraulic properties of 3D rough-walled fractures during shearing: An experimental study. Journal of Hydrology, 555, 169–184. DOI 10.1016/j.jhydrol.2017.10.019. [Google Scholar] [CrossRef]
35. Yin, Q., Jing, H. W., Ma, G. W., Su, H. J., Liu, R. C. (2018). Investigating the roles of included angle and loading condition on the critical hydraulic gradient of real rock fracture networks. Rock Mechanics and Rock Engineering, 51(10), 3167–3177. DOI 10.1007/s00603-018-1526-x.
36. Shen, W. L., Bai, J. B., Li, W. F., Wang, X. Y. (2018). Prediction of relative displacement for entry roof with weak plane under the effect of mining abutment stress. Tunnelling and Underground Space Technology, 71, 309–317. DOI 10.1016/j.tust.2017.08.023. [Google Scholar] [CrossRef]
37. Wu, Q., Liu, J. T., Zhong, Y. P., Wu, Q., Zhou, R. G. (2002). The numeric simulations of water-bursting time-effect for faults in Zhaogezhuang coal mine, Kailuan, China. Journal of China Coal Society, 27, 511–516 (in Chinese). [Google Scholar]
38. Li, L. C., Tang, C. A., Li, G., Yang, T. H. (2009). Damage evolution and delayed groundwater inrush from micro faults in coal seam floor. Chinese Journal of Geotechnical Engineering, 31, 1838–1844 (in Chinese).
39. Zhang, B. Y., Bai, H. B., Zhang, K. (2016). Study on the mechanism of delayed water inrush of collapse column under the influence of mining. Journal of China University of Mining & Technology, 45, 447–454 (in Chinese).
40. Zhang, S. C., Guo, W. J., Li, Y. Y. (2017). Experimental simulation of water-inrush disaster from the floor of mine and its mechanism investigation. Arabian Journal of Geosciences, 10(22), 503. DOI 10.1007/s12517-017-3287-3. [Google Scholar] [CrossRef]
41. Panet, M. (1979). Time-dependent deformations in underground works. Proceedings of the Fourth International Congress on Rock Mechanics, Monteno, Switzerland. pp. 279–289. [Google Scholar]
42. Sun, Z. Y., Zhang, D. L., Fang, Q., Tai, Q. M., Yu, F. C. (2017). Spatial and temporal evolution characteristics of interaction between primary support and tunnel surrounding rock. Chinese Journal of Rock Mechanics and Engineering, 36, 3943–3956 (in Chinese). [Google Scholar]
43. Meng, N. K., Bai, J. B., Chen, Y. (2020). Damage evolution mechanisms of rock induced by blasting with the aid of empty-hole effect. Energies, 13(3), 756. DOI 10.3390/en13030756. [Google Scholar] [CrossRef]
 | This work is licensed under a Creative Commons Attribution 4.0 International License, which permits unrestricted use, distribution, and reproduction in any medium, provided the original work is properly cited. |